Architecture
This section explains how Joulie’s per-node digital twins turn telemetry into enforcement decisions, covering every component from the node agent through the scheduler extender.
If you are new, first read:
Core story
- Agent discovers node hardware (CPU/GPU models, cap ranges, frequency landmarks) and publishes a single
NodeHardwareCR per node. - Twin controller (in the controller manager) ingests
NodeHardware+ Prometheus telemetry, runs the digital twin model, and writesNodeTwin.statusper node (headroom, cooling stress, PSU stress). - Policy controller (in the controller manager) reads
NodeTwin.status+ demand signals, runs a policy algorithm, writesNodeTwin.specand node supply labels (joulie.io/power-profile). Transition state is tracked internally viaNodeTwin.status.schedulableClass. - Agent reads
NodeTwin.specand enforces power caps via RAPL (CPU) and NVML (GPU). Writes control feedback toNodeTwin.status.controlStatus. - Scheduler extender reads
NodeTwin.statusand filters/scores nodes at pod scheduling time based on power profile, facility stress, and workload class. - Telemetry and status feed the next reconcile step, closing the loop.
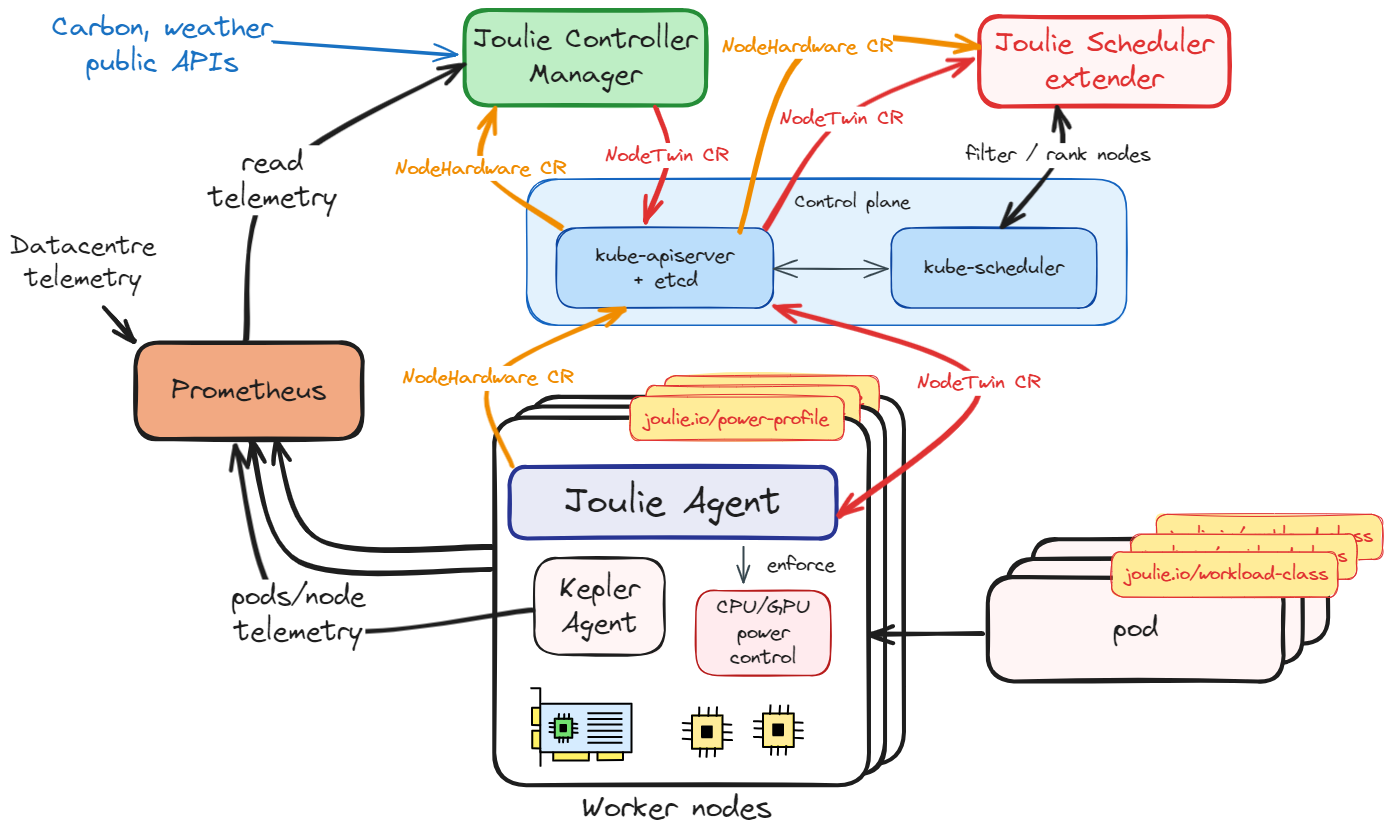
Key CRDs
| CRD | Owner | Purpose |
|---|---|---|
NodeHardware | Agent | Hardware facts: CPU/GPU model, cap ranges, frequency landmarks |
NodeTwin | Controller manager | Desired state (spec: power cap %) + twin output (status: headroom, cooling stress, PSU stress, control feedback) |
Who writes what
NodeTwin is written by two components, so ownership is defined per field. Every write carries a field manager name (joulie-controller-manager, joulie-agent), so kubectl get nodetwin <node> -o yaml --show-managed-fields shows the owner of each field, and contract tests assert that no writer touches another owner’s fields.
| Object | Field | Owner | Meaning |
|---|---|---|---|
NodeHardware | spec.nodeName | Agent | which node this describes |
NodeHardware | status.* | Agent | discovered hardware facts |
NodeHardware | status.cpu.governor, status.gpu.governor | Agent | governor state read without writing, the presets the node accepts, and the baseline the agent restores |
NodeHardware | status.cpu.landmarks | Agent | minimum, nominal and maximum boost frequency from cpufreq |
NodeHardware | status.gpu.powerDomains | Agent | the GPUs that hold a power limit of their own, published only when fewer than status.gpu.count; readers use the count when it is absent |
NodeTwin | spec.* | Controller manager (policy) | desired profile, caps, policy name, draining |
NodeTwin | spec.cpu.governor, spec.gpu.governor | Controller manager (policy) | governor presets; absent means the agent leaves the governor as it is |
NodeTwin | status.controlStatus.* | Agent | what was applied on the node, per component; the twin reads gpu.result to count only a GPU cap that applied |
NodeTwin | status.controlStatus.cpuGovernor, status.controlStatus.gpuGovernor | Agent | outcome of the last governor write, with the native setting in applied |
NodeTwin | status.conditions | Controller manager (twin) | AgentReporting: whether an agent publishes the node’s NodeHardware, so whether anything enforces the caps in spec |
NodeTwin | every other status field | Controller manager (twin) | the twin’s computed state: measured power, headroom, stress scores, PUE |
Rules that follow from the table:
- The controller manager never writes
status.controlStatus, and the agent never writes anything outside it. Both are patch-shaped so a violation is visible in the payload, not only in the result. - Both components derive the object name from the node name with the same function (
pkg/api.ObjectNameForNode), so a node whose name is not a valid object name still maps to one object. - Writers skip a write when nothing changed. A write bumps
resourceVersionand wakes every watcher, so idle nodes must not generate traffic. Unchanged state is rewritten at most every five minutes, which bounds how long a lost object stays unrepaired. statusholds the twin’s current computed state, forecasts included. That is what a twin is; the CRD field descriptions say so.
Component roles
Controller manager
The controller manager contains two reconcile-loop controllers and one background controller:
Reconcile-loop controllers (run each tick):
- Twin controller: ingests per-node measured power into
NodeTwin.status, by default from Prometheus as the OpenTelemetry metricshw.energyandhw.power(see Input metrics (OpenTelemetry)). Runs the cooling stress and PSU stress computations. Incorporates facility metrics (ambient temperature, IT power) when available. When nodes carryjoulie.io/rackorjoulie.io/cooling-zonelabels, the twin computes PSU stress per rack and cooling stress with the zone’s ambient temperature, or the node’s own inlet temperature when the facility reads one. - Policy controller: reads
NodeTwin.status+ pod demand signals, runs the policy algorithm (pkg/controller/policy/), writesNodeTwin.specand thejoulie.io/power-profilenode label. The state machine (pkg/controller/fsm/) enforces downgrade guards: nodes cannot transition from performance to eco while performance-sensitive pods are still running. Transition state is tracked viaNodeTwin.status.schedulableClass.
Background controllers (run on independent intervals):
- Facility metrics poller (
ENABLE_FACILITY_METRICS=falseby default): queries Prometheus for the outdoor ambient temperature, IT and cooling power, and the ambient temperature of each cooling zone, the power of each rack and the inlet temperature of each node, by default as thejoulie.facility.*,joulie.cooling_zone.*,joulie.rack.*andhw.host.ambient_temperaturemetrics. Logs PUE from IT and cooling power and exports the readings asjoulie_twin_facility_*.
Agent
The agent is the node-side enforcement component.
It discovers local hardware, publishes NodeHardware, reads NodeTwin.spec, and applies CPU and GPU controls through configured backends (RAPL for CPU, NVML for GPU). Control feedback is written to NodeTwin.status.controlStatus.
Scheduler extender
The scheduler extender is a read-only HTTP service that participates in the Kubernetes scheduling cycle. When a new pod is created, kube-scheduler calls the extender at two endpoints:
- Filter (
POST /filter): rejects eco and draining nodes for performance pods. Standard pods pass all nodes. - Prioritize (
POST /prioritize): scores each node 0-100 usingscore = headroomScore*0.7 + (100-coolingStress)*0.15 + trendBonus + profileBonus + pressureRelief.
The score is pod-specific: the extender estimates how many watts the pod will add to each node (from its CPU/GPU requests) and subtracts that from the node’s capped power budget before scoring. Heavy pods reduce headroom more, naturally steering them toward nodes with more power budget remaining.
kubectl plugin
The kubectl joulie plugin (cmd/kubectl-joulie) shows the cluster’s energy state in the terminal. It reads the NodeTwin and NodeHardware objects through the API server, nothing else of Joulie’s, so it shows the twin data the scheduler extender and the agents act on:
kubectl joulie status: the cluster summary and one row per node: power against its cap, profile, applied caps, twin scores, requested resources, agent condition.kubectl joulie top: the same as a live dashboard, with node details and pod placement.kubectl joulie node <node>,kubectl joulie pods: one node in detail; where performance and standard pods run.
No configuration is needed. The plugin reads your current kubeconfig context (commands and flags).
Digital twin model
The pkg/controller/twin package implements an O(1) parametric model computing:
- Power headroom: remaining capacity before hitting the configured cap
- Cooling stress (0-100): predicted % of cooling capacity in use. High means risk of thermal throttling.
- PSU stress (0-100): predicted % of PDU/rack power capacity in use. High means risk of power brownout.
All three start from a measured node power reading supplied by the controller manager. Cooling stress is a single closed-form expression in computeCoolingStress: measured power over node TDP, scaled by an ambient temperature multiplier. There is no cooling model interface and no alternative implementation to select.
Read in this order
- CRD and Policy Model – NodeHardware and NodeTwin CRDs, policy state machine
- Joulie Controller Manager – twin controller, policy controller, facility metrics poller
- Joulie Agent – hardware discovery, cap enforcement via RAPL/NVML
- Digital Twin – O(1) parametric model: headroom, cooling stress, PSU stress
- Scheduler Extender – filter and prioritize endpoints, scoring formula
- Energy-Aware Scheduling – workload-class-aware pod placement
- Policy Algorithms – available policy implementations and tuning
- Input Telemetry and Actuation Interfaces – Prometheus queries, RAPL/NVML control paths
- Hardware Modeling and Physical Power Model – CPU/GPU power curves for simulation
- Metrics Reference – all exported Prometheus metrics
Energy-Aware Scheduling
How Joulie combines measured power (OpenTelemetry hardware metrics or Kepler), workload classification, digital twin predictions, and PUE-weighted scoring to make energy-aware scheduling decisions.