Architecture
This section explains how Joulie’s per-node digital twins turn telemetry into enforcement decisions, covering every component from the node agent through the scheduler extender.
If you are new, first read:
Core story
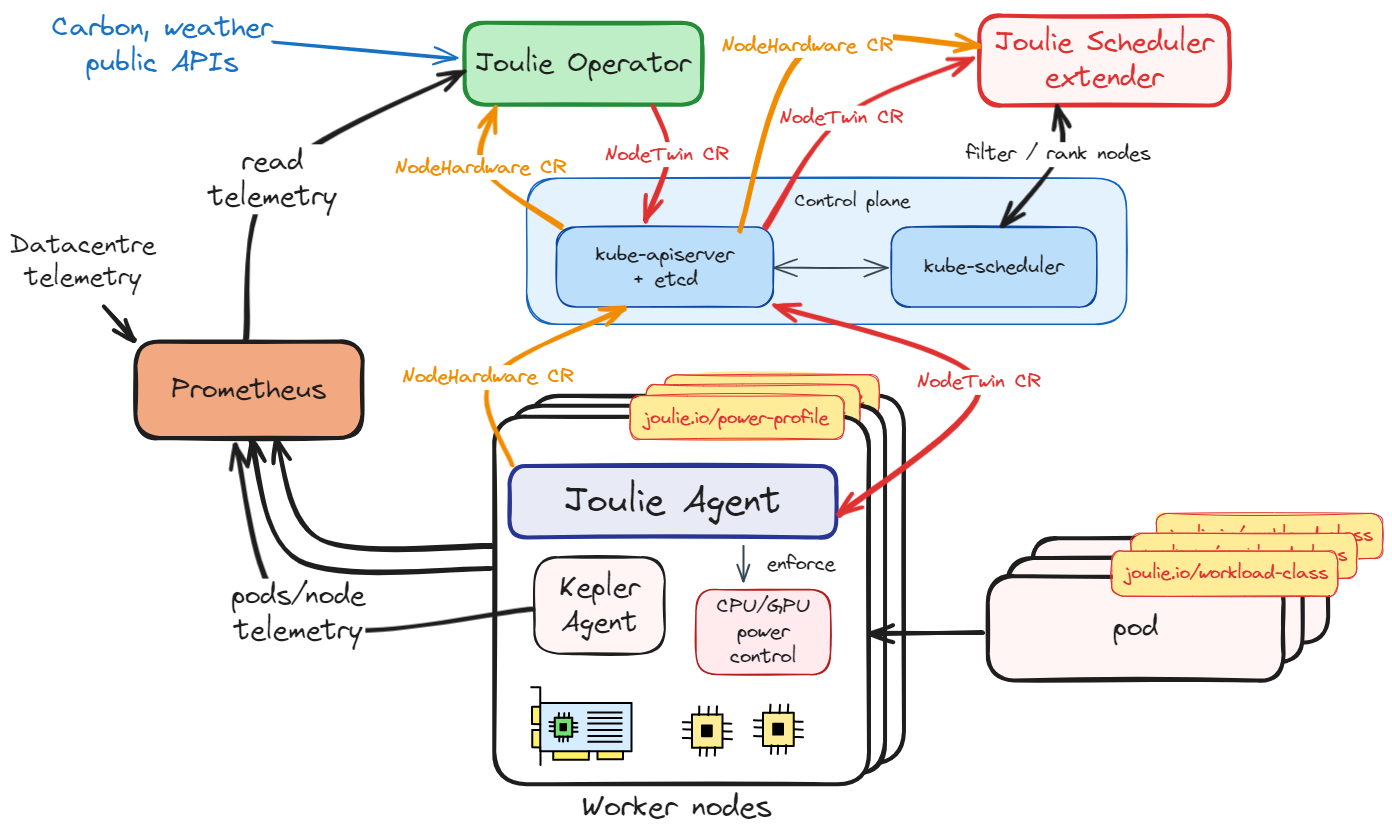
- Agent discovers node hardware (CPU/GPU models, cap ranges, frequency landmarks) and publishes a single
NodeHardwareCR per node. - Operator twin controller ingests
NodeHardware+ Prometheus telemetry, runs the digital twin model, and writesNodeTwin.statusper node (headroom, cooling stress, PSU stress). - Operator policy controller reads
NodeTwin.status+ demand signals, runs a policy algorithm, writesNodeTwin.specand node supply labels (joulie.io/power-profile). Transition state is tracked internally viaNodeTwin.status.schedulableClass. - Agent reads
NodeTwin.specand enforces power caps via RAPL (CPU) and NVML (GPU). Writes control feedback toNodeTwin.status.controlStatus. - Scheduler extender reads
NodeTwin.statusand filters/scores nodes at pod scheduling time based on power profile, facility stress, and workload class. - Telemetry and status feed the next reconcile step, closing the loop.
Key CRDs
| CRD | Owner | Purpose |
|---|---|---|
NodeHardware | Agent | Hardware facts: CPU/GPU model, cap ranges, frequency landmarks |
NodeTwin | Operator | Desired state (spec: power cap %) + twin output (status: headroom, cooling stress, PSU stress, control feedback) |
Component roles
Operator
The operator contains two reconcile-loop controllers and one background controller:
Reconcile-loop controllers (run each tick):
- Twin controller: ingests per-node telemetry into
NodeTwin.status. Runs theCoolingModeland PSU stress computations. Incorporates facility metrics (ambient temperature, PUE) when available. When nodes carryjoulie.io/rackorjoulie.io/cooling-zonelabels, the twin computes PSU stress per-rack and cooling stress with per-zone ambient temperature. - Policy controller: reads
NodeTwin.status+ pod demand signals, runs the policy algorithm (pkg/operator/policy/), writesNodeTwin.specand thejoulie.io/power-profilenode label. The state machine (pkg/operator/fsm/) enforces downgrade guards: nodes cannot transition from performance to eco while performance-sensitive pods are still running. Transition state is tracked viaNodeTwin.status.schedulableClass.
Background controllers (run on independent intervals):
- Facility metrics poller (
ENABLE_FACILITY_METRICS=falseby default): queries Prometheus for ambient temperature, IT power, and cooling power. Computes PUE for twin and scheduler consumption.
Agent
The agent is the node-side enforcement component.
It discovers local hardware, publishes NodeHardware, reads NodeTwin.spec, and applies CPU and GPU controls through configured backends (RAPL for CPU, NVML for GPU). Control feedback is written to NodeTwin.status.controlStatus.
Scheduler extender
The scheduler extender is a read-only HTTP service that participates in the Kubernetes scheduling cycle. When a new pod is created, kube-scheduler calls the extender at two endpoints:
- Filter (
POST /filter): rejects eco and draining nodes for performance pods. Standard pods pass all nodes. - Prioritize (
POST /prioritize): scores each node 0-100 usingscore = headroomScore*0.7 + (100-coolingStress)*0.15 + trendBonus + profileBonus + pressureRelief.
The score is pod-specific: the extender estimates how many watts the pod will add to each node (from its CPU/GPU requests) and subtracts that from the node’s capped power budget before scoring. Heavy pods reduce headroom more, naturally steering them toward nodes with more power budget remaining.
kubectl plugin
The kubectl joulie plugin (cmd/kubectl-joulie) provides immediate visibility into the cluster’s energy state:
kubectl joulie status: per-node overview of power profiles, cap settings, twin stress scores.
No configuration is needed. The plugin reads your current kubeconfig context.
Digital twin model
The pkg/operator/twin package implements an O(1) parametric model computing:
- Power headroom: remaining capacity before hitting the configured cap
- Cooling stress (0-100): predicted % of cooling capacity in use. High means risk of thermal throttling.
- PSU stress (0-100): predicted % of PDU/rack power capacity in use. High means risk of power brownout.
The CoolingModel interface is pluggable. Default: LinearCoolingModel (algebraic proxy). Future: openModelica reduced-order thermal simulation via the same interface.
Read in this order
- CRD and Policy Model – NodeHardware and NodeTwin CRDs, policy state machine
- Joulie Operator – twin controller, policy controller, facility metrics poller
- Joulie Agent – hardware discovery, cap enforcement via RAPL/NVML
- Digital Twin – O(1) parametric model: headroom, cooling stress, PSU stress
- Scheduler Extender – filter and prioritize endpoints, scoring formula
- Energy-Aware Scheduling – workload-class-aware pod placement
- Policy Algorithms – available policy implementations and tuning
- Input Telemetry and Actuation Interfaces – Prometheus queries, RAPL/NVML control paths
- Hardware Modeling and Physical Power Model – CPU/GPU power curves for simulation
- Metrics Reference – all exported Prometheus metrics
Energy-Aware Scheduling
How Joulie combines Kepler telemetry, workload classification, digital twin predictions, and PUE-weighted scoring to make energy-aware scheduling decisions.