Workload and Power Simulator
This document defines the Joulie simulator design and how it integrates with Joulie.
Architecture at a glance
The simulator extends the same control path used on real nodes:
- Node labels define simulated hardware identity.
- Operator resolves hardware from
NodeHardwarewhen available, otherwise from labels/inventory fallback. - Operator writes desired node profile (
NodeTwin.spec). - Agent reads desired state and sends control intents.
- Simulator emulates telemetry/control behavior per node and exposes HTTP endpoints.
- Next reconcile loop reacts to updated simulated state.
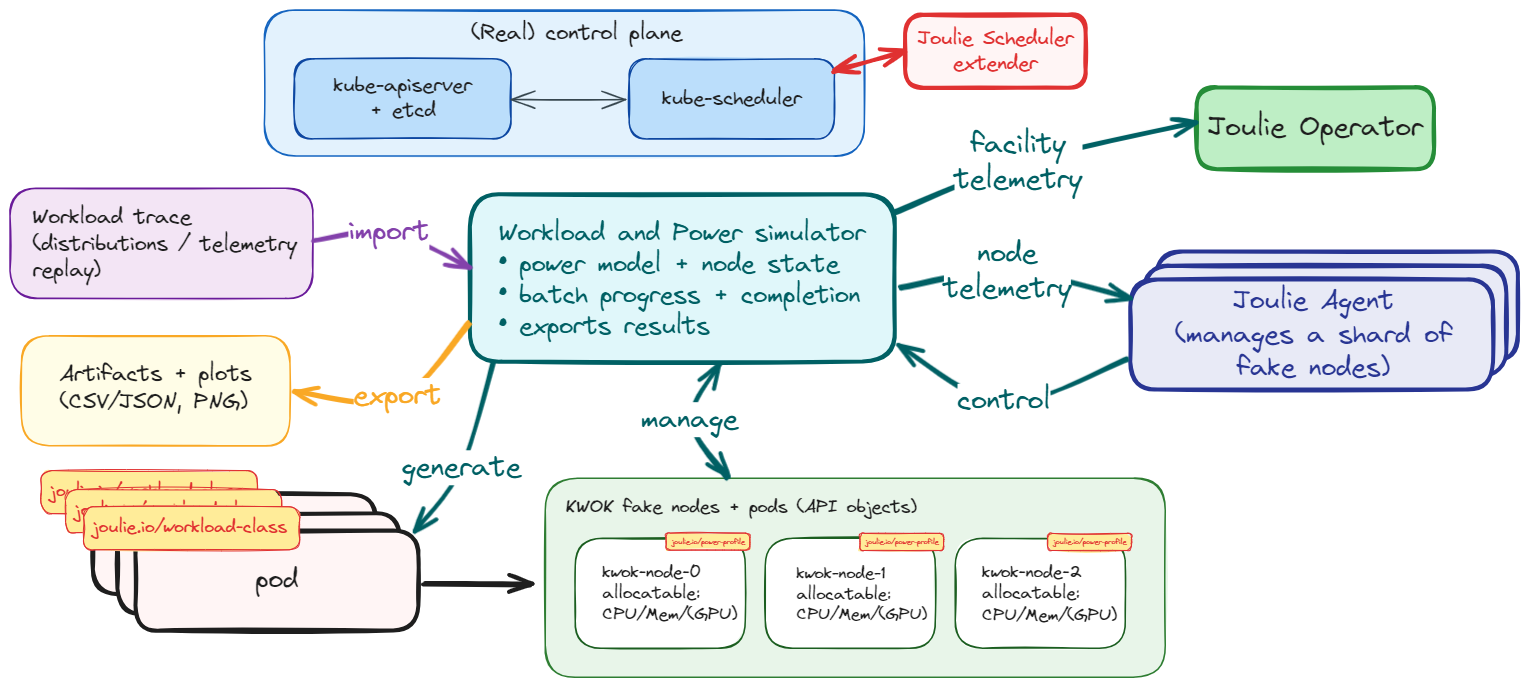
The diagram shows the end-to-end loop:
- Kubernetes keeps scheduling and pod lifecycle as source of truth.
- Joulie operator writes desired node states (
NodeTwin.spec). - Agent (pool or daemonset mode) translates desired state into control intents.
- Simulator receives control intents and updates per-node hardware model state.
- Simulator exposes telemetry back to the agent through HTTP, closing the loop.
This separation lets you validate control policies with realistic scheduler behavior while simulating hardware dynamics.
Goals
- Keep Kubernetes scheduling real (real pod placement/lifecycle).
- Simulate hardware telemetry and control interfaces (CPU and GPU).
- Provide reproducible, comparable experiments across Joulie and WAO.
The workload side of the simulator is now split into two docs:
- Workload Generation: how realistic AI traces are built
- Workload Simulator: how those traces are consumed and progressed at runtime
Full architecture mirroring
The simulator now mirrors the complete Joulie control architecture. All three control layers are exercisable in simulation:
- Operator policy controller: runs the full policy algorithm (static partition, queue-aware) with simulated
NodeHardwareandNodeTwin.status. - Scheduler extender: participates in scheduling decisions for simulated KWOK pods; filter and score logic is identical to the production path.
This means the heterogeneous benchmark experiment can exercise scenarios A through C entirely in simulation before any bare-metal deployment.
Facility model
The simulator models three facility-level signals that feed NodeTwin.status and the scheduler extender scoring formula:
- PSU stress (
psuStress): fraction of node PSU capacity in use, derived from current node power draw relative to configured PSU headroom. Computed aspsuStress = nodeP / psuCapacityW * 100. - Cooling stress (
coolingStress): thermal load proxy derived from CPU and GPU junction temperatures relative to throttle thresholds. Computed as a weighted average of CPU and GPU thermal margins. - PUE proxy: the simulator tracks a per-tick PUE estimate as
(total IT load + cooling overhead) / total IT load. Cooling overhead scales with cooling stress.
These signals are exported in Prometheus metrics and through the /state/{node} HTTP endpoint.
The scheduler extender reads them from NodeTwin.status (populated by the operator twin controller from simulator-sourced telemetry).
Fake Prometheus query endpoint
The simulator serves a /api/v1/query endpoint that returns facility metrics in the standard Prometheus instant-query response format. This allows the operator’s facility metrics poller to query the simulator directly without needing a real Prometheus instance.
Supported metrics:
| Query | Gauge |
|---|---|
datacenter_ambient_temperature_celsius | Sinusoidal ambient temperature |
datacenter_total_it_power_watts | Sum of all simulated node power |
datacenter_cooling_power_watts | Derived from IT power and PUE |
| Any query containing “pue” | Simulated PUE |
To use it, set FACILITY_PROMETHEUS_ADDRESS on the operator to point at the simulator (e.g., http://joulie-telemetry-sim.joulie-sim-demo.svc.cluster.local:18080).
Online workload classification
In production, the operator’s classifier observes running pods and determines their workload class (“performance” or “standard”) from CPU/GPU utilization metrics scraped from Prometheus. In simulation, there is no real Prometheus with per-pod metrics. The simulator solves this with two mechanisms:
Sim utilization annotations
Instead of setting joulie.io/workload-class directly on pods (which would give the classifier perfect information), the simulator annotates each pod with its simulated utilization profile:
| Annotation | Description |
|---|---|
sim.joulie.io/cpu-util-pct | Simulated CPU utilization (0-100%) |
sim.joulie.io/gpu-util-pct | Simulated GPU utilization (0-100%) |
sim.joulie.io/memory-pressure-pct | Simulated memory pressure (0-100%) |
sim.joulie.io/io-intensity | Simulated I/O intensity (0-1) |
These values come from the workloadProfile section of the trace file, which encodes realistic utilization distributions per workload type (e.g., training jobs have high GPU util, preprocessing jobs have high CPU util).
Classifier sim-annotation fallback
When CLASSIFY_SIM_ANNOTATION_FALLBACK=true is set on the operator, the classifier reads sim annotations as a fallback when Prometheus metrics are unavailable. It then applies its normal heuristic rules to determine the workload class:
- High CPU utilization (>65%) with low memory pressure: performance
- High GPU utilization (>50%) or GPU-dominant workload: performance
- Otherwise: standard
The classifier naturally misclassifies some pods at boundary conditions. For example, a pod at 63% CPU utilization is classified as “standard” even though its trace intended “performance”. This simulates a realistic online classifier.
Configurable noise
The CLASSIFY_SIM_NOISE_PCT env var (default: 10) adds Gaussian noise to the utilization values before classification. With 10% noise, a pod with 70% CPU utilization might be seen as 63% or 77%, causing occasional misclassification at threshold boundaries. This simulates measurement error in real metrics pipelines.
Why not use the trace class directly?
Setting joulie.io/workload-class from the trace is “cheating” because it gives the scheduler and operator perfect workload information that would not be available in a real deployment. The online classification approach is more realistic: the system must observe the workload and decide, with some inherent uncertainty.
Validation disclaimer
GPU support has been validated in simulator mode only (no bare-metal GPU access yet). Host GPU code paths are designed for NVIDIA/AMD nodes and become fully testable once real GPU nodes are available.
Design choice: hybrid simulation
The simulator is not a fake scheduler.
- Pod placement and pod lifetime stay real in Kubernetes.
- Simulator reads cluster state (pods/nodes) and derives synthetic hardware state per node.
- Joulie reads telemetry and sends control intents through HTTP endpoints.
This gives one source of truth for workload location: Kubernetes API.
In KWOK mode:
- API server and scheduler are real.
- fake nodes and fake workload pods are API objects.
- simulator drives telemetry and batch completion.
- agent runs in
poolmode with one logical loop per simulated node.
Large virtual clusters with kind + KWOK
You are not constrained to a large real hardware cluster to evaluate Joulie policies.
- keep a real Kubernetes control plane and scheduler,
- attach many fake worker nodes,
- run real operator/agent/simulator control loops,
- scale experiments to many nodes and pods with low hardware cost.
This is the model used in the benchmark experiment:
Typical flow:
- Create kind cluster (real control-plane + worker runtime nodes).
- Add many KWOK fake nodes labeled
joulie.io/managed=true. - Deploy simulator + agent pool + operator.
- Run workload traces and observe throughput/energy behavior.
Practical scripts are in:
experiments/01-cpu-only-benchmark/scripts/10_setup_cluster.shexperiments/01-cpu-only-benchmark/scripts/20_run_benchmark.sh
Example run:
source experiments/01-cpu-only-benchmark/.venv/bin/activate
experiments/01-cpu-only-benchmark/scripts/10_setup_cluster.sh
experiments/01-cpu-only-benchmark/scripts/20_run_benchmark.sh
Integration with Joulie
NodeTwin.spec (what)
- Set by Joulie operator.
- Defines desired per-node target (profile/cap).
Telemetry backend selection (how)
- Configured via environment variables on the agent.
- Routes input signals and control sinks:
- telemetry source (
host,http, …) - control backend (
host,http, …)
- telemetry source (
In simulator mode, set these env vars on the agent:
TELEMETRY_CPU_SOURCE=http+TELEMETRY_CPU_HTTP_ENDPOINT=<sim-url>/telemetry/{node}-> agent reads/telemetry/{node}.TELEMETRY_CPU_CONTROL=http+TELEMETRY_CPU_CONTROL_HTTP_ENDPOINT=<sim-url>/control/{node}-> agent writes/control/{node}.TELEMETRY_GPU_CONTROL=http+TELEMETRY_GPU_CONTROL_HTTP_ENDPOINT=<sim-url>/control/{node}-> agent writes GPU power-cap intents to/control/{node}.
NodeHardware (what the node is)
- Published automatically by the agent when available.
- Describes discovered CPU/GPU identity and control capability.
- Not normally authored by hand in simulator examples.
For simulator bootstrap, node labels remain the lightweight source of hardware identity.
NodeHardware is the normalized, observable view of that identity once the agent is running.
The most useful bootstrap labels are:
joulie.io/hw.cpu-modeljoulie.io/hw.cpu-socketsjoulie.io/hw.gpu-modeljoulie.io/hw.gpu-count- vendor presence labels such as
feature.node.kubernetes.io/pci-10de.present=trueorfeature.node.kubernetes.io/pci-1002.present=true
The operator can also infer GPU presence from allocatable extended resources like nvidia.com/gpu or amd.com/gpu.
Simulator HTTP API
GET /telemetry/{node}- returns simulated per-node telemetry (
cpu.*,gpu.*, pod counters).
- returns simulated per-node telemetry (
POST /control/{node}- accepts actions like
rapl.set_power_cap_watts,dvfs.set_throttle_pct,gpu.set_power_cap_watts. - returns
result=applied|blocked|error.
- accepts actions like
GET /state/{node}- returns current internal node state.
GET /metrics- Prometheus metrics.
GET /healthz- health check.
Simulator observability
The simulator exposes Prometheus metrics and debug endpoints:
GET /debug/nodes: node selection, matched override profile, resolved model hints, and current node state.GET /debug/events: recent telemetry/control events (ring buffer).GET /debug/energy: integrated simulated energy totals.
Detailed metric names and labels are documented in:
Installation
Use a separate simulator deployment (joulie-telemetry-sim) in namespace joulie-sim-demo.
Install from release (recommended)
The simulator has its own Helm chart, published to the same OCI registry as the main Joulie chart.
Install directly from the OCI chart release:
helm upgrade --install joulie-simulator oci://registry.cern.ch/mbunino/joulie/joulie-sim \
  --version <version> \
  -n joulie-sim-demo \
  --create-namespace \
  --set image.tag=<version>
Or use the make target (uses the local chart source):
make simulator-install TAG=<version>
Override simulator settings via --set or a values file:
helm upgrade --install joulie-simulator oci://registry.cern.ch/mbunino/joulie/joulie-sim \
  --version <version> \
  -n joulie-sim-demo \
  --create-namespace \
  --set image.tag=<version> \
  --set env.SIM_POLL_INTERVAL=10s \
  --set serviceMonitor.enabled=true
To uninstall:
make simulator-uninstall
# or: helm uninstall joulie-simulator -n joulie-sim-demo
Build and push image (when developing)
If you changed simulator source code, build and push from repo root:
make simulator-build TAG=<tag>
make simulator-push TAG=<tag>
Then install using the local chart with your custom tag:
make simulator-install TAG=<tag>
This keeps simulator lifecycle independent from operator/agent lifecycle.
Node scope and class mapping
Current simulator supports:
SIM_NODE_SELECTOR:- only nodes matching this label selector are simulated.
- default in deploy manifest:
joulie.io/managed=true.
SIM_NODE_CLASS_CONFIG:- YAML file with label-matched model overrides.
- used as an optional override layer on top of inventory/label-based hardware identity.
The preferred hardware bootstrap flow is now:
- put CPU/GPU identity on node labels,
- let the simulator/operator resolve that identity against the shared inventory,
- use
SIM_NODE_CLASS_CONFIGonly when you want scenario-specific overrides or calibration tweaks.
Hardware profile parameters
Class model overrides now support:
baseIdleW,pMaxWalphaUtil,betaFreqfMinMHz,fMaxMHzraplCapMinW,raplCapMaxWdvfsRampMscpuCapApplyTauMs,cpuTelemetryWindowMscpuAmbientTempC,cpuThermalTauMs,cpuWattsPerDeltaCcpuThermalThrottleStartC,cpuThermalThrottleFullCgpu.telemetryWindowMs,gpu.thermalTauMsgpu.ambientTempC,gpu.wattsPerDeltaCgpu.thermalThrottleStartC,gpu.thermalThrottleFullC
Hardware profile parsing and validation are implemented in:
simulator/pkg/hw/profile.go
Invalid class/base profiles fail fast at simulator startup.
Power model
The runtime loop now combines:
- workload-derived utilization and bottleneck signals,
- hardware inventory or override parameters,
- control settling dynamics,
- telemetry averaging windows,
- thermal state.
The detailed formulas live in:
At runtime the important behaviors are:
- DVFS ramp dynamics (
dvfsRampMs) from target throttle to effectivefreqScale - CPU cap settling (
cpuCapApplyTauMs) - GPU cap settling (
gpu.capApplyTauMs) - averaged exported telemetry (
cpuTelemetryWindowMs,gpu.telemetryWindowMs) - thermal-throttle behavior for sustained high-power operation
Workload trace and execution
Enable with:
SIM_WORKLOAD_TRACE_PATH=/path/to/trace.jsonl
The simulator loads type=job records, injects pods, and advances per-job CPU work units every tick.
Completion time increases when DVFS/RAPL reduce node effective speed.
Pod lifecycle currently uses delete-on-complete.
Helper tools:
simulator/cmd/workloadgen: generate synthetic JSONL traces from distributions.simulator/cmd/traceextract: normalize/extract input JSONL into simulator trace schema.
WorkloadProfile fields and physical effects
Each job record in the trace can reference a WorkloadProfile by name.
The profile fields influence the simulator’s physical model:
cpuIntensity: highdrives CPU utilization signal toward the upper range of the power model, producing higherPvalues and increasing cooling stress.gpuIntensity: highdrives GPU utilization signal toward max TDP, increasing GPU power draw and PSU stress.cpuSensitivity: highamplifies the slowdown effect when CPU frequency is reduced. The simulator applies:effectiveSpeed = nominalSpeed * (1 - (1 - freqScale) * cpuSensitivityFactor). WithcpuSensitivity: high, a 20% frequency reduction causes approximately 20% slowdown; withlow, the same reduction causes roughly 5% slowdown.gpuSensitivity: highamplifies throughput reduction when the GPU is operating below its configured power cap.
This means the heterogeneous benchmark produces meaningfully different per-class completion-time results across scenarios, not just aggregate energy differences.
KWOK flow summary
- Create KWOK fake nodes with
type=kwokandjoulie.io/managed=true. - Taint fake nodes with
kwok.x-k8s.io/node=fake:NoSchedule. - Run operator + simulator + agent pool on real node(s).
- Set agent telemetry env vars to route to simulator HTTP.
- Inject trace workload (pods tolerate kwok taint + select
type=kwok). - Observe power/control/job-completion metrics.
Algorithm details are split in:
Related example:
examples/07 - simulator-gpu-powercaps/
Heterogeneous benchmark experiment
The simulator is the execution environment for the heterogeneous cluster benchmark, which exercises all three Joulie control scenarios (A: baseline, B: caps only, C: caps + scheduler) on a mixed GPU + CPU cluster.
See: