Homogeneous H100 NVL Benchmark
This page reports results from the homogeneous H100 NVL cluster benchmark experiment:
Scope
The benchmark compares three baselines on a homogeneous cluster of NVIDIA H100 NVL GPU nodes plus CPU-only nodes:
A: simulator only (Joulie-free)B: Joulie with static partition policyC: Joulie with queue-aware policy
This experiment is designed for a direct comparison with the heterogeneous benchmark: same 41 total nodes, same workload configuration, but all GPU nodes are a single family (H100 NVL) instead of 5 different families.
Experimental setup
Cluster and nodes
- kind control-plane + worker (real control plane)
- 41 managed KWOK nodes: 33 H100 NVL GPU nodes + 8 CPU-only nodes
- Workload pods target KWOK nodes via selector + toleration
Node inventory - detailed cluster composition
GPU nodes (33 total, 264 GPUs) - all NVIDIA H100 NVL
| Node prefix | Count | GPU model | GPUs/node | GPU cap range | Host CPU | CPU cores/node | RAM/node |
|---|---|---|---|---|---|---|---|
| kwok-h100-nvl | 33 | NVIDIA H100 NVL | 8 | 200-400 W | AMD EPYC 9654 96-Core | 192 | 1536 GiB |
All 33 GPU nodes are identical - any GPU job can be scheduled on any GPU node without hardware-family constraints. This is the key architectural difference from experiment 02.
CPU-only nodes (8 total) - identical to experiment 02
| Node prefix | Count | CPU model | CPU cores/node | RAM/node |
|---|---|---|---|---|
| kwok-cpu-highcore | 2 | AMD EPYC 9965 192-Core | 384 (2x192) | 1536 GiB |
| kwok-cpu-highfreq | 2 | AMD EPYC 9375F 32-Core | 64 (2x32) | 770 GiB |
| kwok-cpu-intensive | 4 | AMD EPYC 9655 96-Core | 192 (2x96) | 1536 GiB |
Total: 41 nodes, 264 GPUs (all H100 NVL), ~7100 CPU cores.
Comparison to experiment 02: same node count (41), but exp 03 has 264 GPUs vs exp 02’s 188 GPUs (H100 NVL has 8 GPUs/node, replacing the lower-density mixed families).
Hardware models in simulator
GPU power model:
P_gpu(g) = IdleW + (PeakW - IdleW) * g^computeGamma
Single GPU family - all nodes use identical parameters:
| GPU family | IdleW (W) | PeakW (W) | computeGamma | GPU cap range |
|---|---|---|---|---|
| NVIDIA H100 NVL | 80 | 400 | 1.50 | 200-400 W |
At 65% GPU cap: loses 1 - 0.65^(1/1.50) ~= 24.7% GPU throughput.
H100 NVL idle power floor: 80 W/GPU x 264 GPUs = 21,120 W - this is the dominant base cluster power draw.
Full power-model details: Power Simulator
Run configuration
- Seeds:
3 - Jobs:
500 - Mean inter-arrival:
0.15 s - Time scale:
60x - Timeout:
3600 s - Perf ratio:
25%, GPU ratio:35% - Workload types:
debug_eval,single_gpu_training,cpu_preprocess,cpu_analytics - Policy caps: CPU eco at
65%, GPU eco at65%of peak
Algorithms used
Controller policies
static_partition:hpCount = round(N * 0.40)-> ~16 performance nodes, ~25 eco nodes
queue_aware_v1:baseCount = round(N * 0.40), dynamic adjustment from live perf-pod counthpCount = clamp(max(baseCount, queueNeed), 2, 20, N)
- Downgrade guard:
performance -> ecodeferred while performance-sensitive pods run on node
Results summary
Per-seed results
| Baseline | Seed | Wall (s) | Throughput (jobs/sim-hr) | Energy (kWh sim) | Avg power (W) |
|---|---|---|---|---|---|
| A | 1 | 367.93 | 72.08 | 141.58 | 23089 |
| A | 2 | 485.38 | 55.01 | 187.37 | 23161 |
| A | 3 | 415.24 | 63.87 | 177.40 | 25634 |
| B | 1 | 366.71 | 72.32 | 130.41 | 21338 |
| B | 2 | 485.17 | 55.03 | 171.79 | 21245 |
| B | 3 | 415.35 | 63.85 | 162.36 | 23455 |
| C | 1 | 367.55 | 72.15 | 131.23 | 21422 |
| C | 2 | 485.41 | 55.01 | 171.90 | 21248 |
| C | 3 | 415.96 | 63.76 | 149.36 | 21545 |
Baseline means (3 seeds, all completed)
| Baseline | Mean wall (s) | Mean throughput (jobs/sim-hr) | Mean energy (kWh sim) | Mean cluster power (W) |
|---|---|---|---|---|
| A | 422.9 | 63.65 | 168.78 | 23961 |
| B | 422.4 | 63.73 | 154.85 | 22013 |
| C | 423.0 | 63.64 | 150.83 | 21405 |
Relative to A:
- B: energy -8.2%, throughput +0.1% (negligible)
- C: energy -10.6%, throughput 0.0% (negligible)
Plot commentary
Runtime distribution
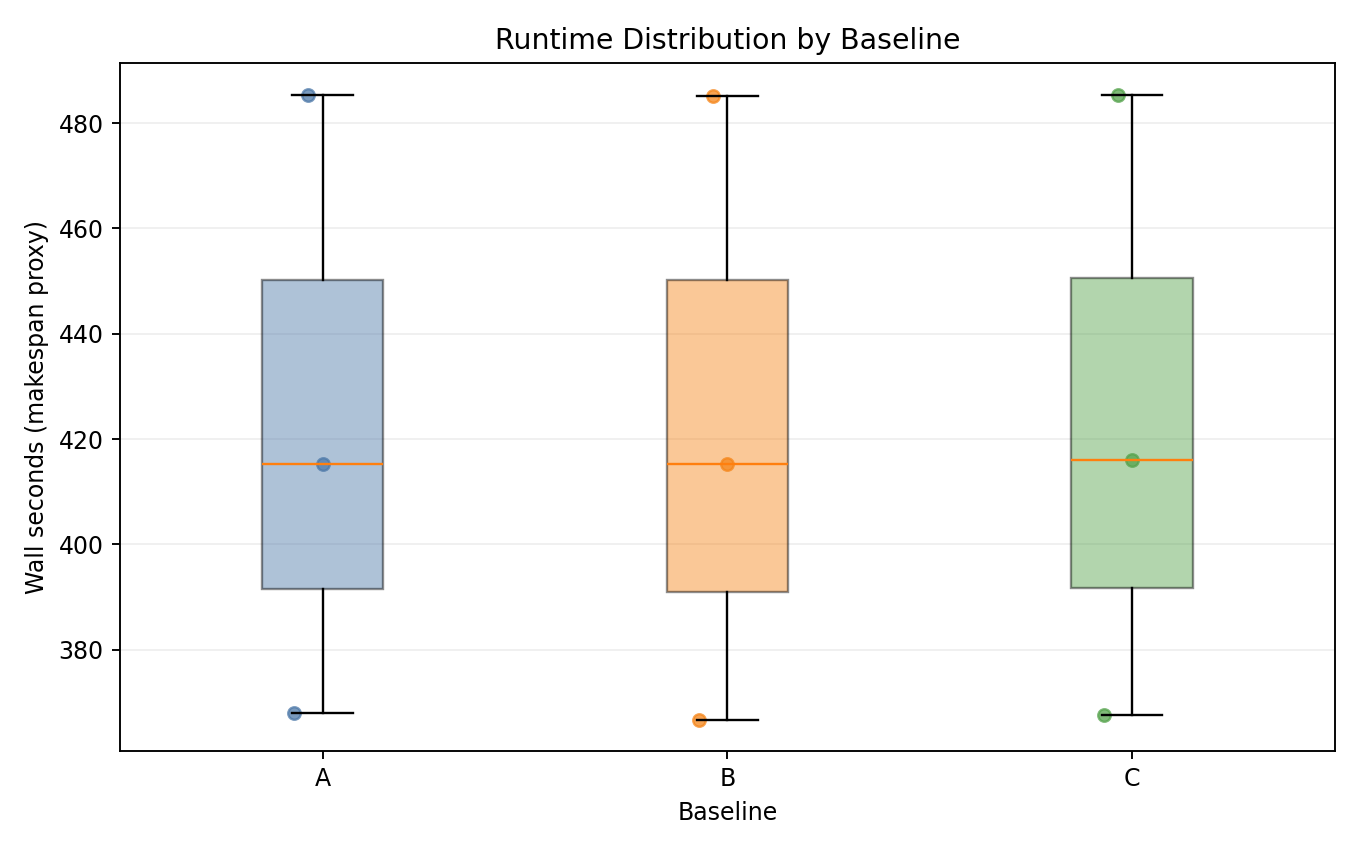
- All three baselines complete within identical wall-time windows per seed.
- No measurable throughput penalty from Joulie policies.
Energy vs makespan
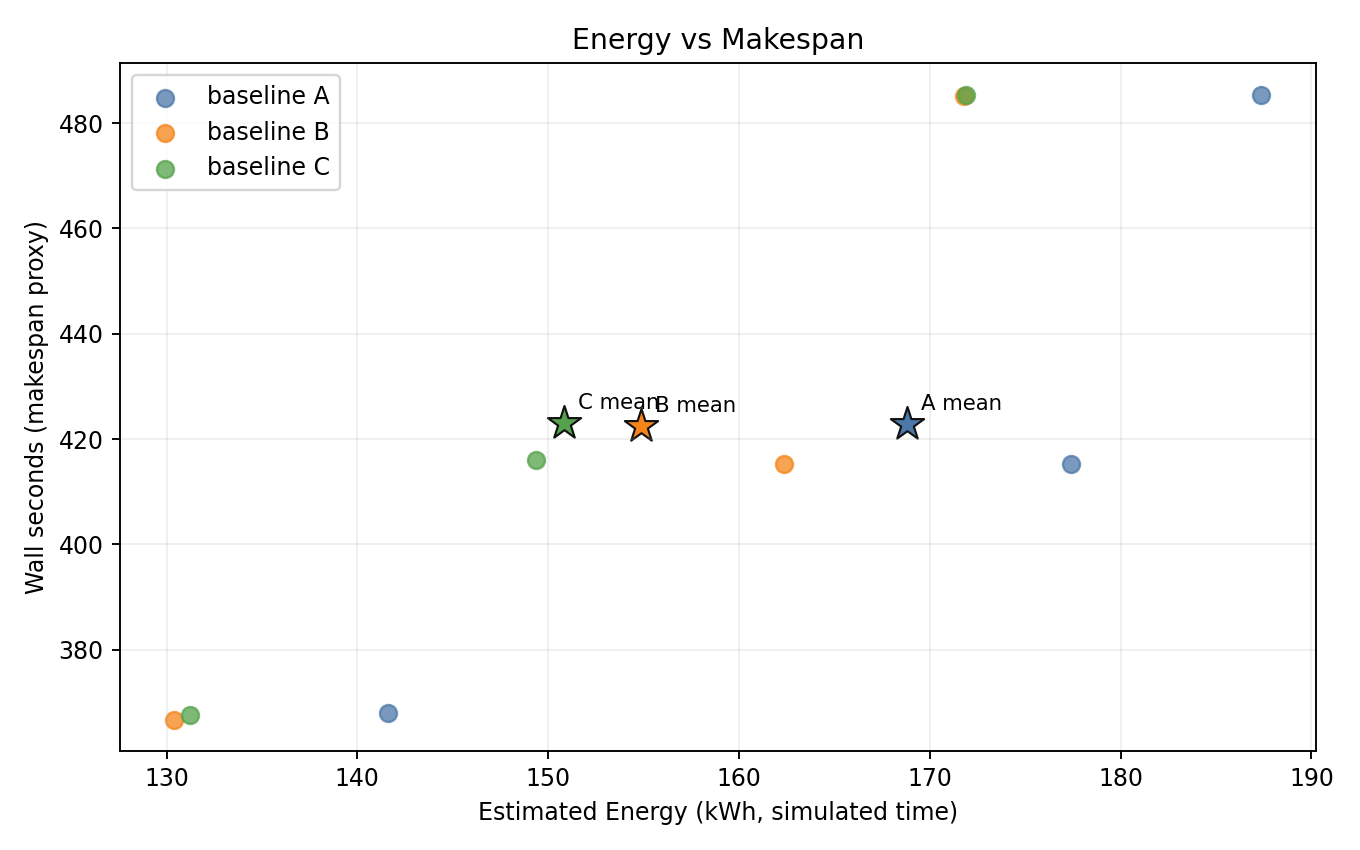
- B and C are consistently shifted to lower energy with identical makespan.
- C achieves the lowest energy across all seeds.
Baseline means
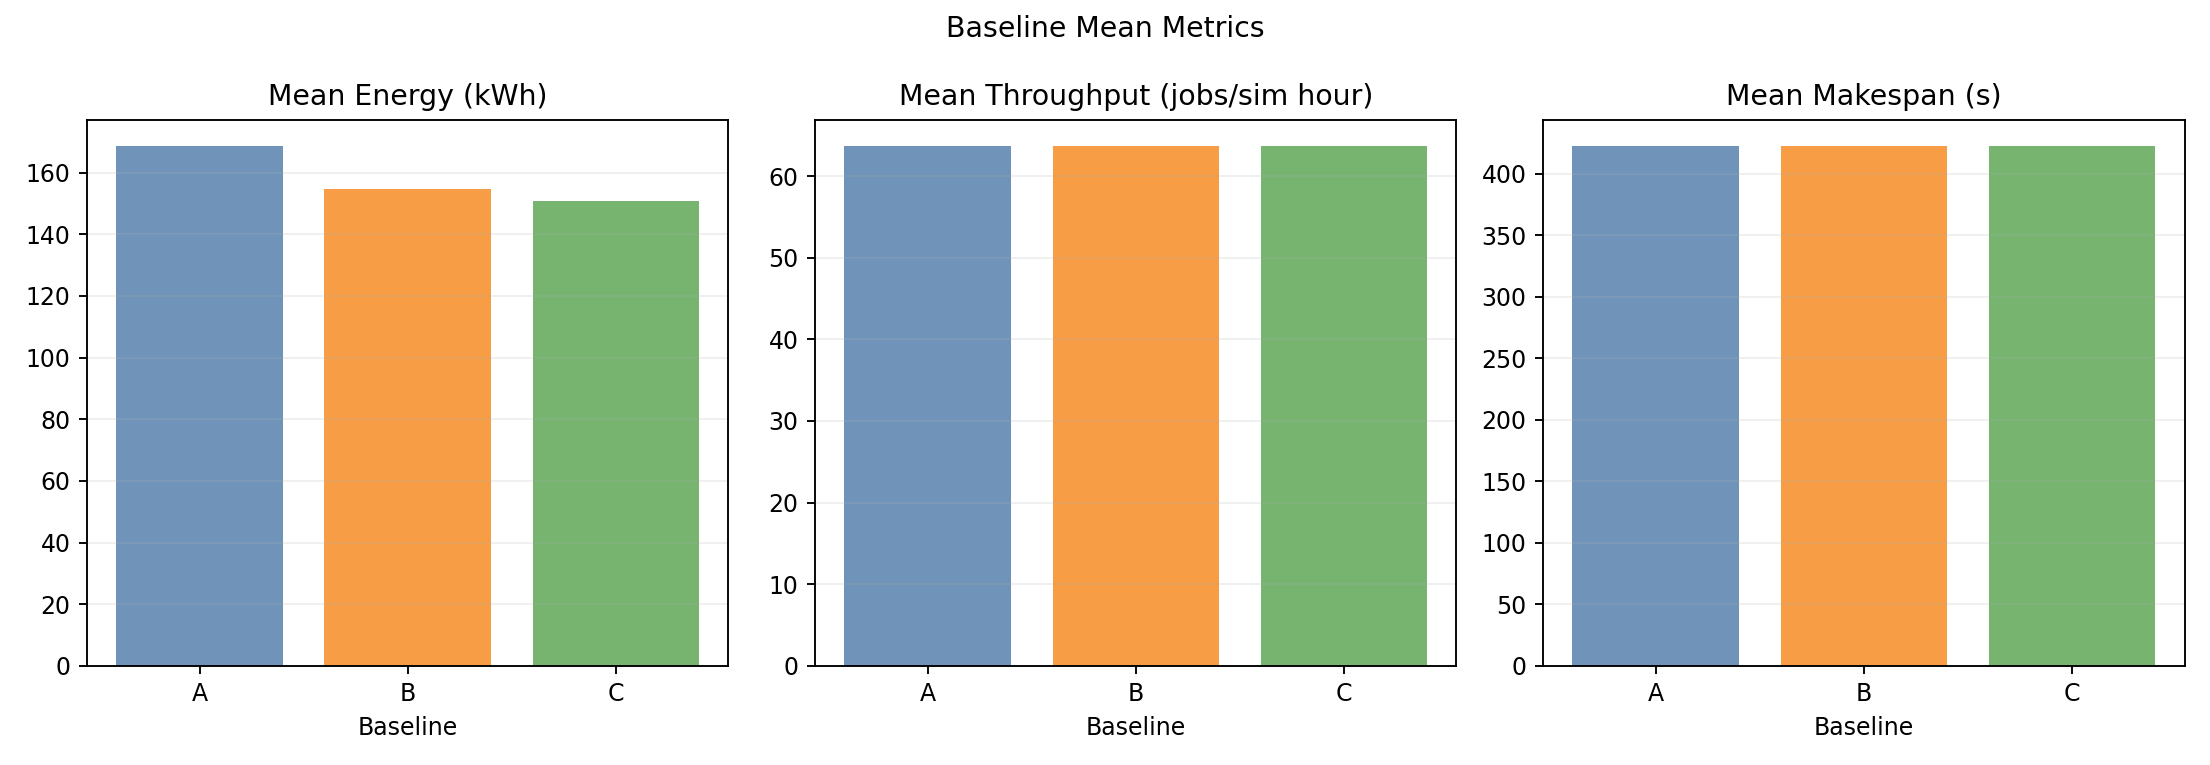
- Throughput and wall-time bars are indistinguishable across baselines.
- Energy bars clearly show the step-down: A > B > C.
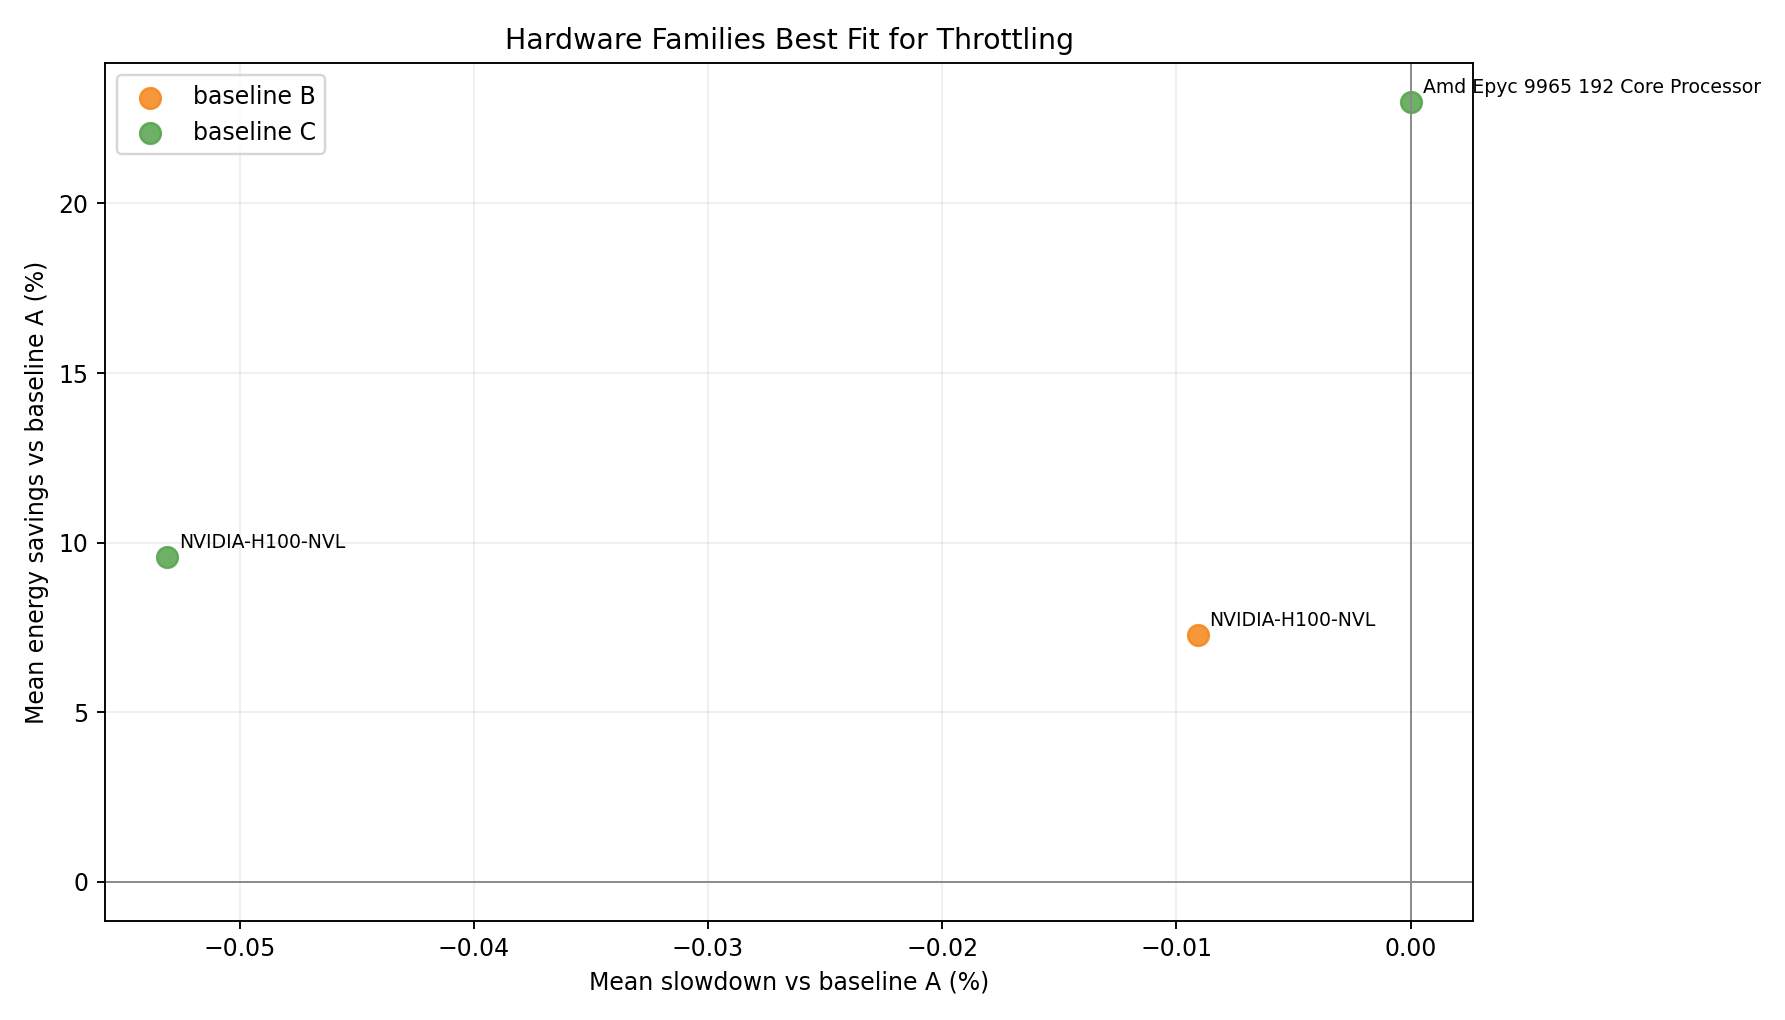
Relative tradeoff vs A
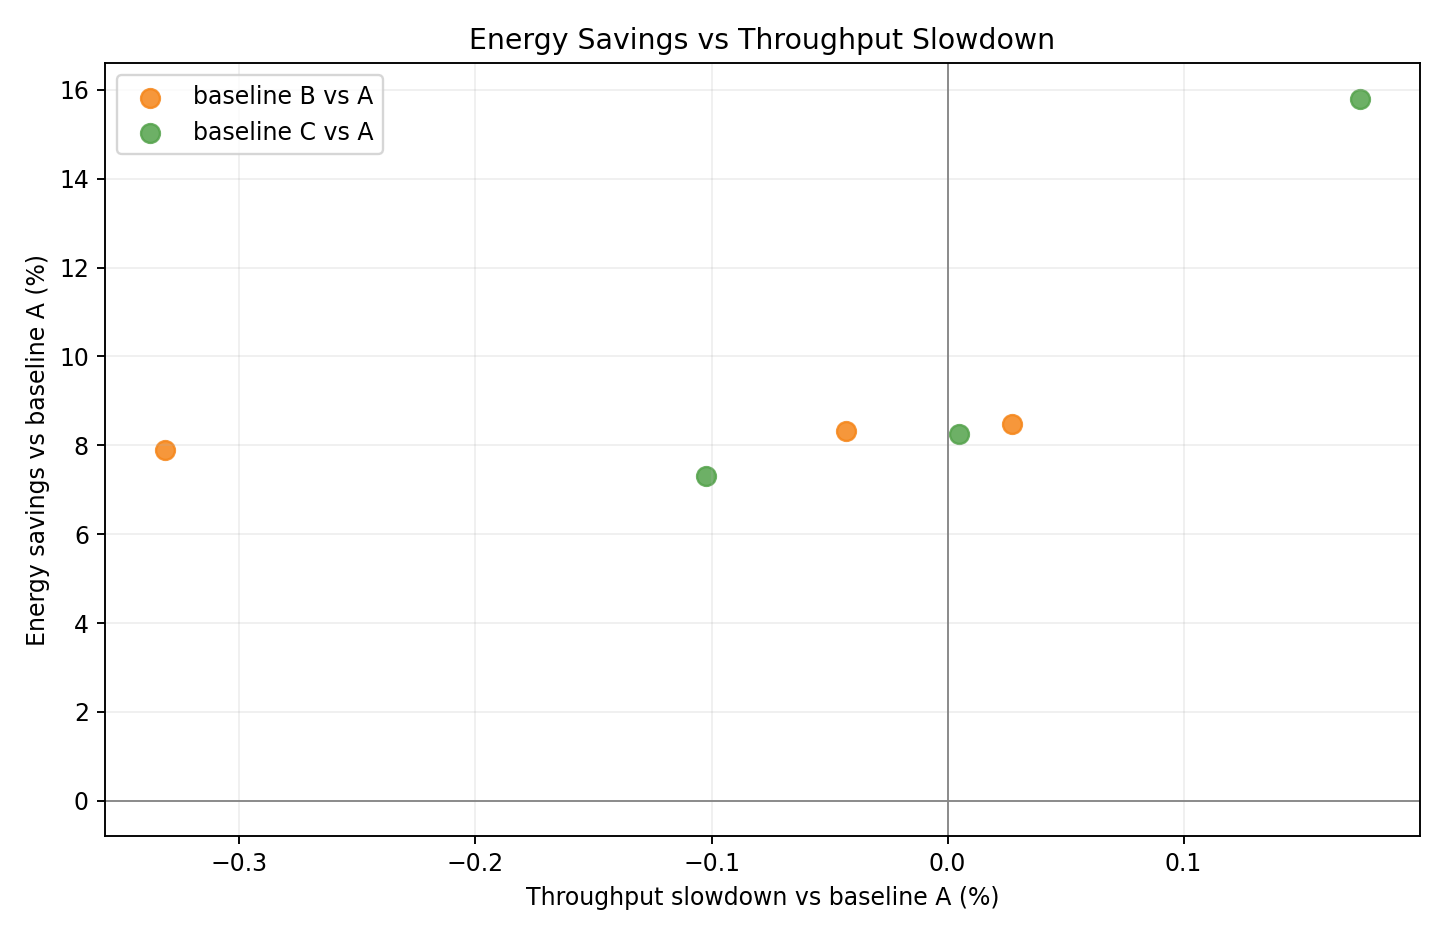
- Per-seed scatter shows both B and C in the lower-energy region with no throughput loss.
- C seeds consistently achieve lower energy than B seeds.
Relative tradeoff bars vs A
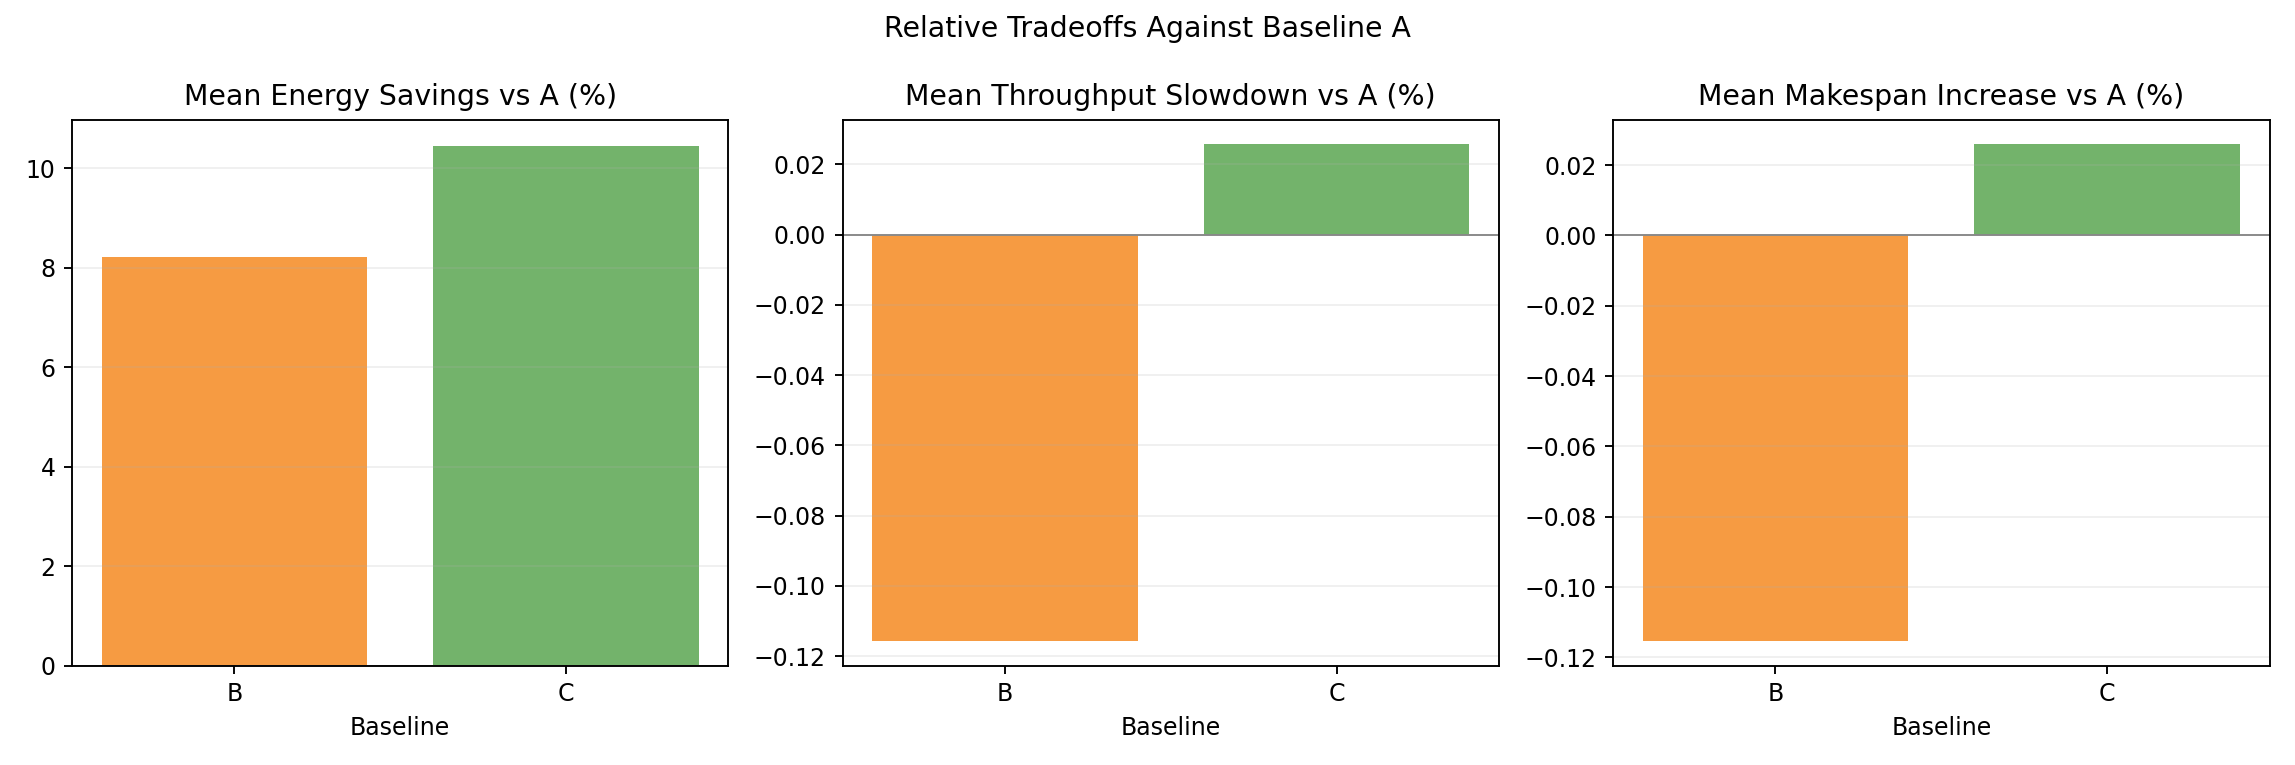
- Mean energy and throughput deltas: B at -8.2% / +0.1%, C at -10.6% / 0.0%.
- Queue-aware (C) achieves meaningfully better energy savings than static (B).
Hardware family tradeoff vs A
- Single GPU family; both B and C achieve energy reduction with minimal throughput loss.
Hardware family rankings - baseline B
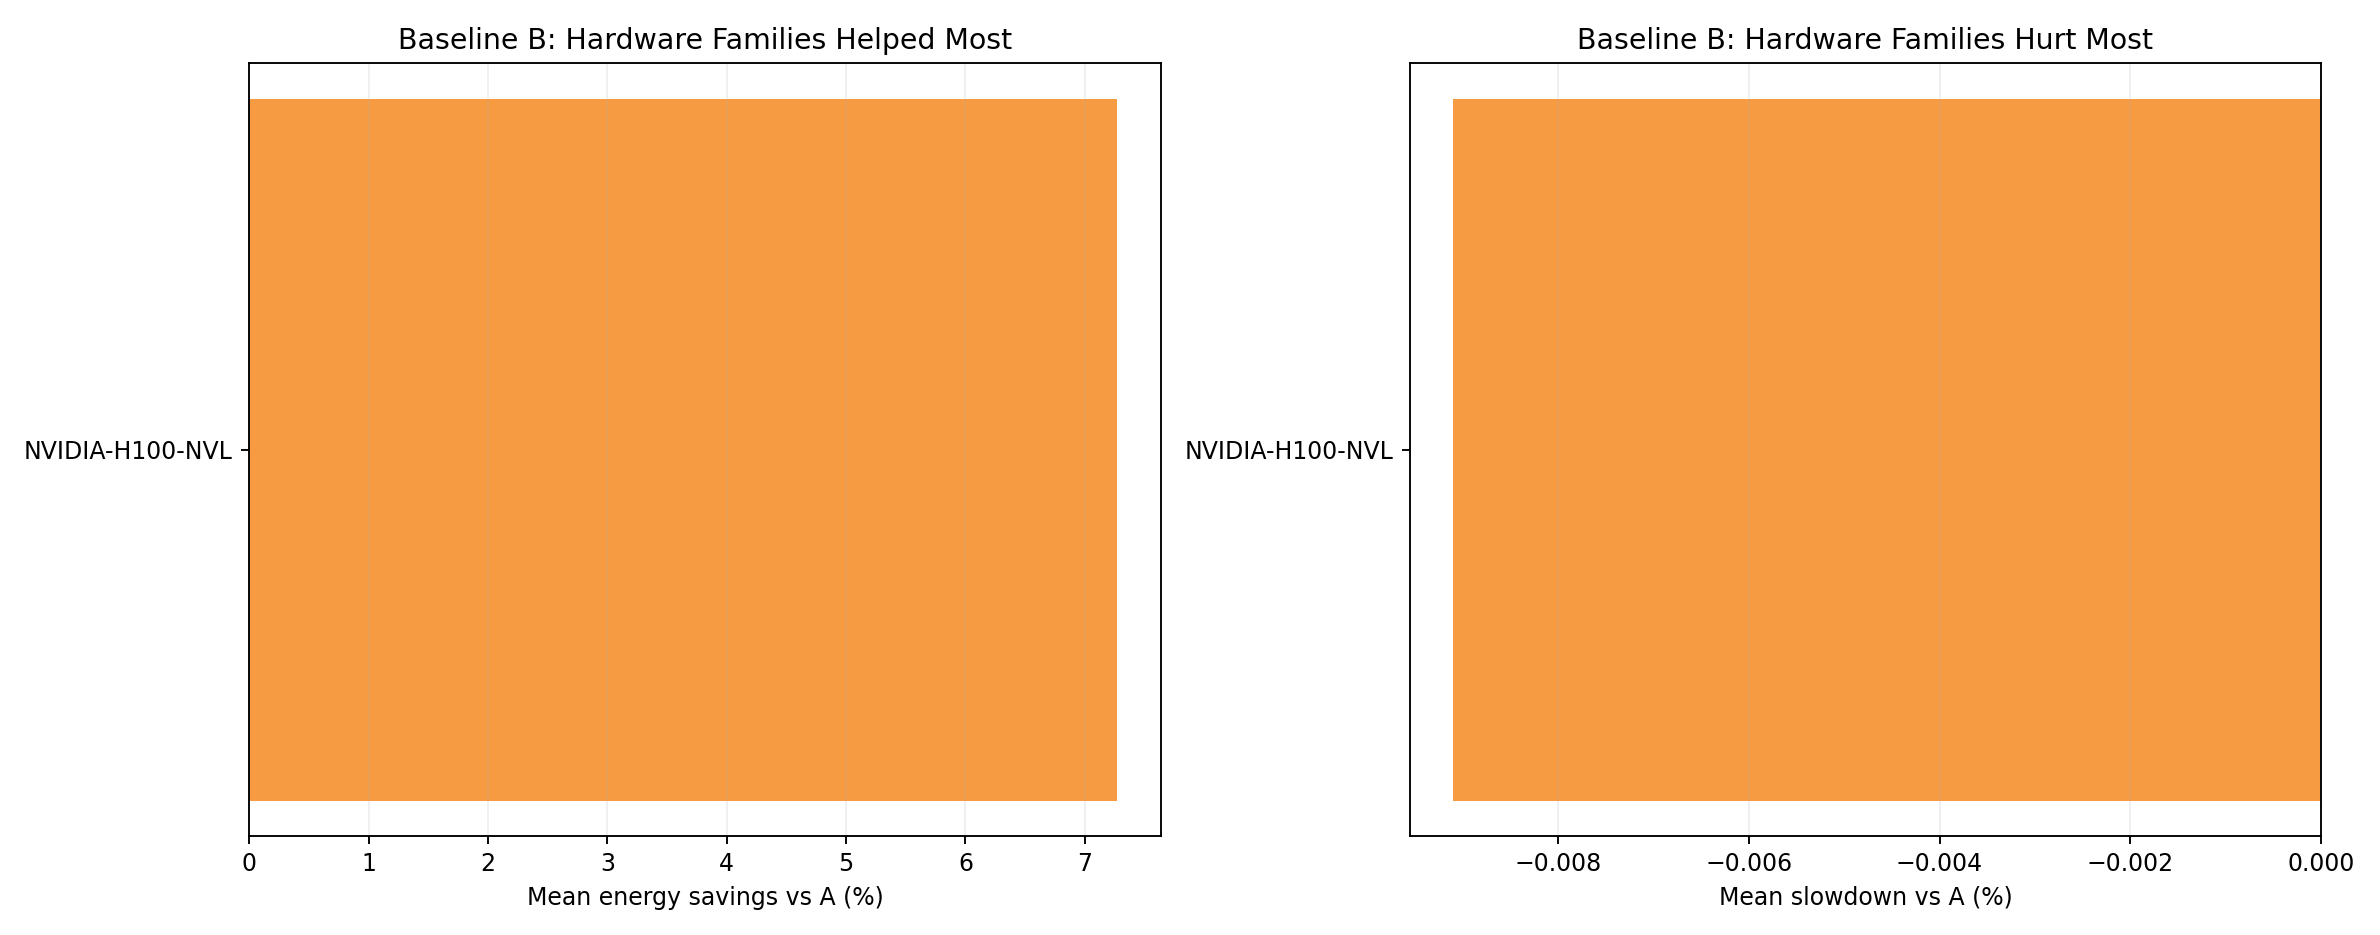
- H100 NVL is the only GPU family. Under B, energy reduction is uniform.
Hardware family rankings - baseline C
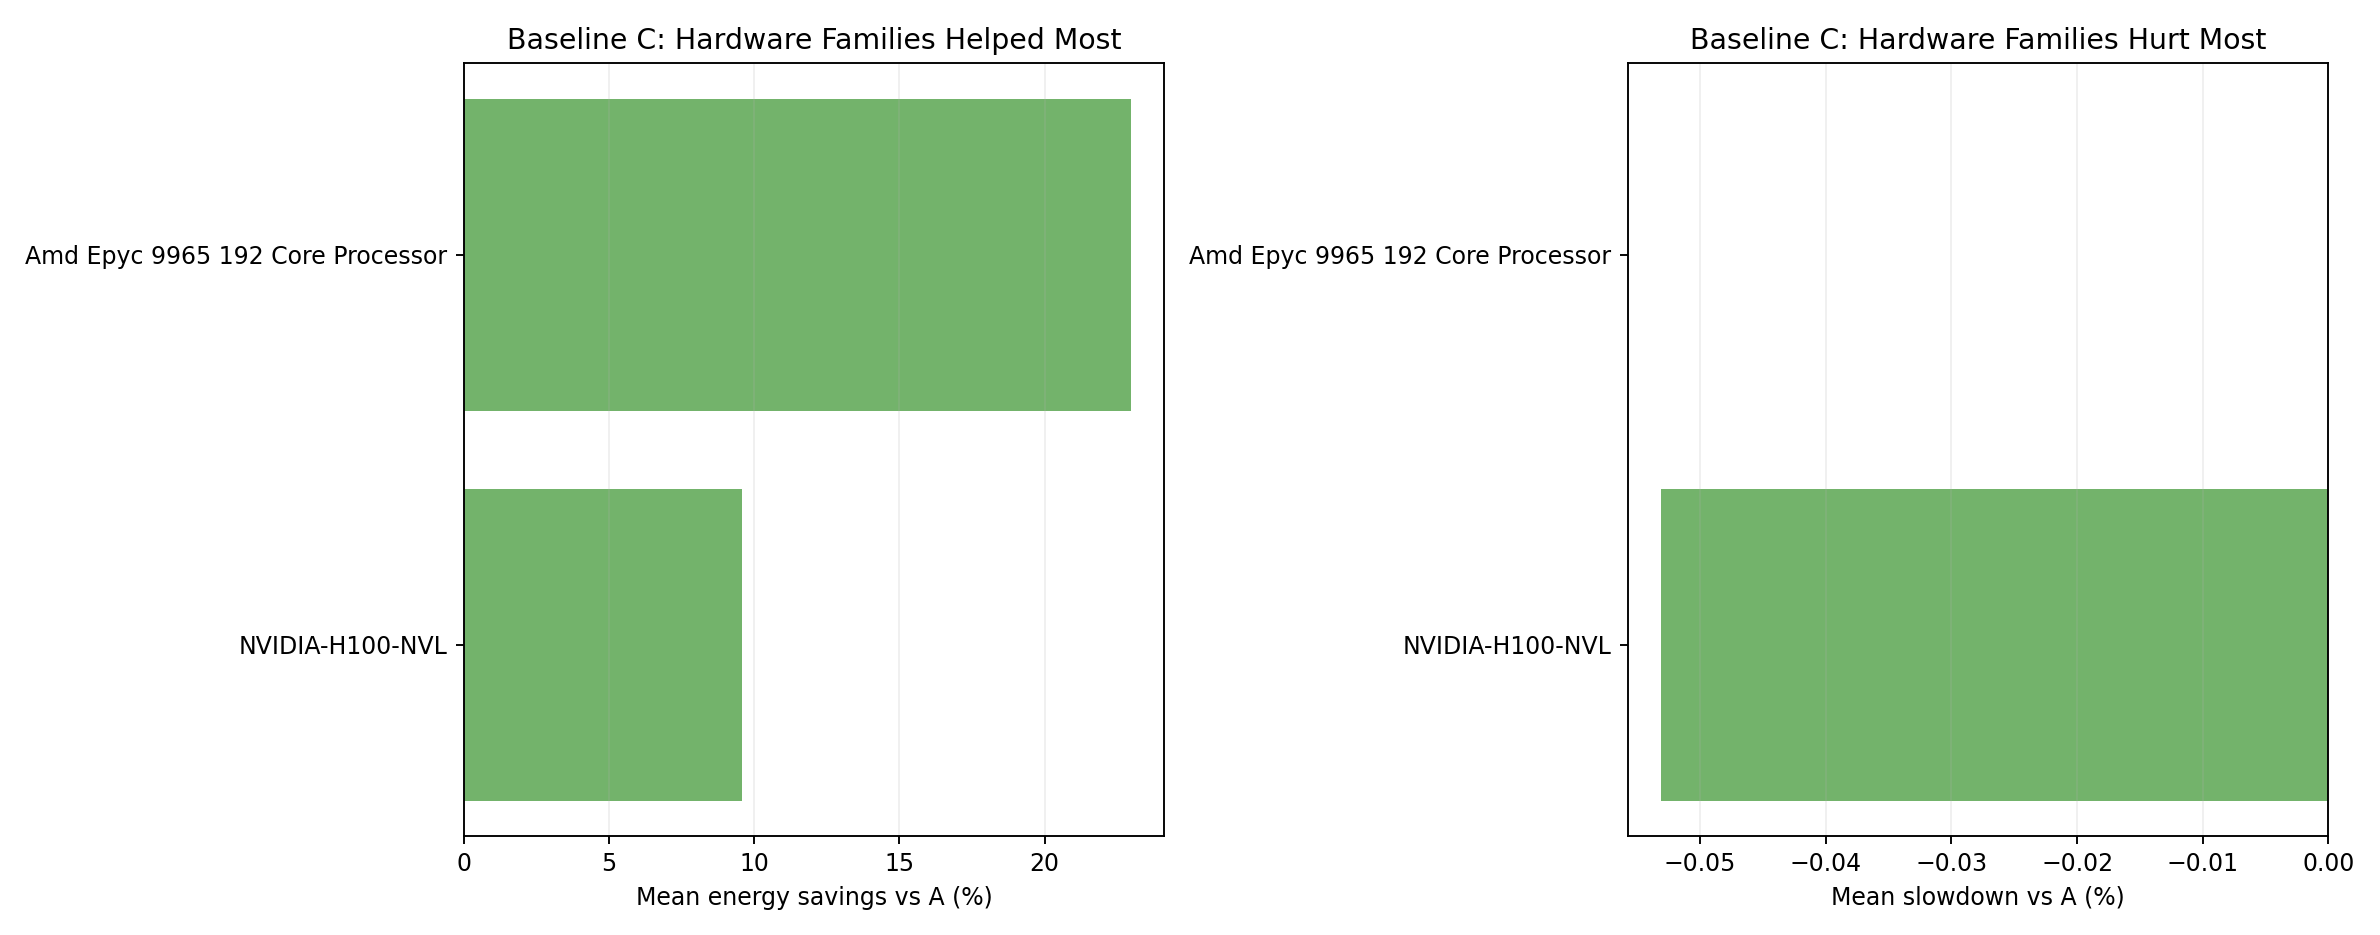
- C achieves deeper energy reduction than B for the H100 NVL family.
Completion summary
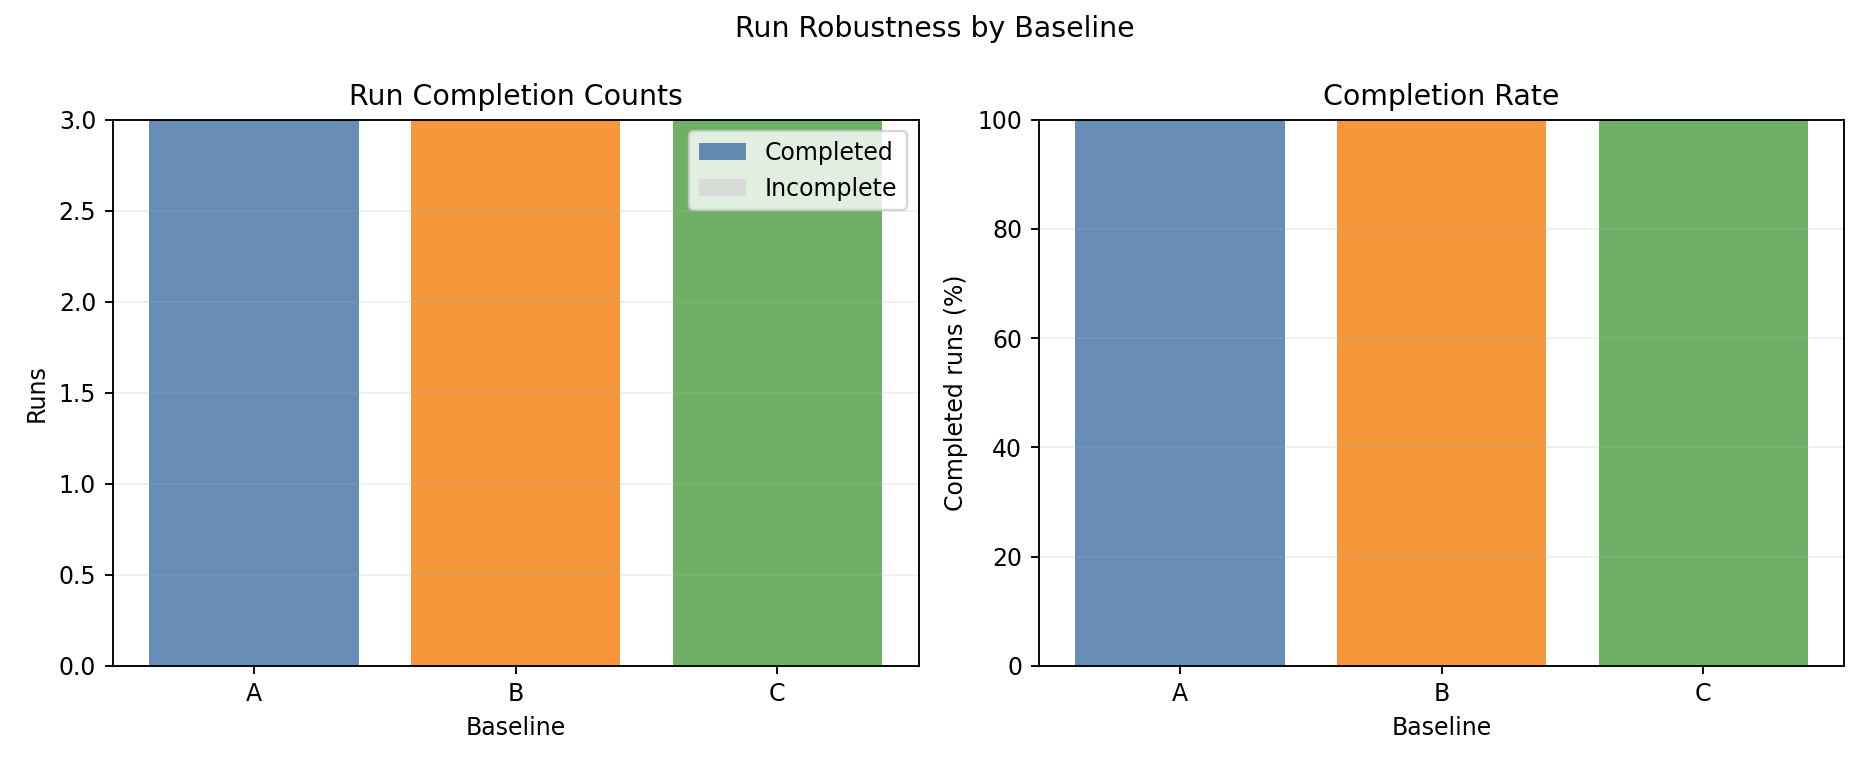
- All baselines achieve 100% completion across all 3 seeds.
Interpretation
Why does Joulie save 8-10% energy on the homogeneous H100 cluster?
GPU power caps directly reduce the dominant energy contributor: with 264 H100 NVL GPUs at 80 W idle / 400 W peak, GPU power dominates >95% of cluster energy. Capping eco-node GPUs to 65% of peak power directly reduces this largest term.
Homogeneous scheduling flexibility: any GPU job can land on any GPU node without hardware-family constraints. This allows the scheduler to pack performance-sensitive jobs onto uncapped nodes efficiently.
Throughput preserved: the 25% performance-affinity ratio means 75% of jobs tolerate eco nodes. With ~16 performance nodes and ~25 eco nodes, there is ample capacity for performance-sensitive jobs on uncapped nodes.
Why does C outperform B significantly?
Queue-aware (C) achieves -10.6% vs B’s -8.2% by dynamically adjusting the HP node count. During periods of low performance-sensitive demand, it reduces HP nodes below the static 40% allocation, putting more nodes into eco profile. On a 500-job sustained workload, demand fluctuations create windows where queue-aware can temporarily increase eco coverage.
Homogeneous vs heterogeneous comparison
| Metric | Exp 02 (heterogeneous) | Exp 03 (homogeneous) |
|---|---|---|
| GPU count | 188 (5 families) | 264 (all H100 NVL) |
| B energy delta | -6.2% | -8.2% |
| C energy delta | -6.3% | -10.6% |
| Throughput delta | ~0% | ~0% |
The homogeneous cluster achieves deeper savings because: (1) more GPUs are affected by capping, and (2) the uniform hardware allows queue-aware to exploit demand fluctuations more effectively.
Best-fit use case
- Joulie achieves -8.2% energy (static) / -10.6% energy (queue-aware) on homogeneous H100 NVL clusters with zero throughput impact.
queue_aware_v1outperformsstatic_partitionby 2.4 percentage points, making it the recommended policy for GPU-heavy clusters.- The key enabler is GPU power cap control at 65% on eco nodes.