Heterogeneous GPU Cluster Benchmark
This page reports results from the heterogeneous GPU cluster benchmark experiment:
Scope
The benchmark compares three baselines on a heterogeneous cluster mixing 5 distinct GPU hardware families plus CPU-only nodes:
A: simulator only (Joulie-free)B: Joulie with static partition policyC: Joulie with queue-aware policy
Experimental setup
Cluster and nodes
- kind control-plane + worker (real control plane)
- 41 managed KWOK nodes: 33 GPU nodes + 8 CPU-only nodes
- Workload pods target KWOK nodes via selector + toleration
Node inventory - detailed cluster composition
This is a heterogeneous GPU cluster mixing 5 distinct GPU hardware families across 33 GPU nodes, plus 8 CPU-only nodes.
GPU nodes (33 total, 188 GPUs)
| Node prefix | Count | GPU model | GPUs/node | GPU cap range | Host CPU | CPU cores/node |
|---|---|---|---|---|---|---|
| kwok-h100-nvl | 12 | NVIDIA H100 NVL | 8 | 200-400 W | AMD EPYC 9654 96-Core | 192 |
| kwok-h100-sxm | 6 | NVIDIA H100 80GB HBM3 | 4 | 350-700 W | Intel Xeon Gold 6530 | 64 |
| kwok-l40s | 7 | NVIDIA L40S | 4 | 200-350 W | AMD EPYC 9534 64-Core | 128 |
| kwok-mi300x | 2 | AMD Instinct MI300X | 8 | 350-750 W | AMD EPYC 9534 64-Core | 128 |
| kwok-w7900 | 6 | AMD Radeon PRO W7900 | 4 | 200-295 W | AMD EPYC 9534 64-Core | 128 |
GPU count summary: 96 + 24 + 28 + 16 + 24 = 188 GPUs total across NVIDIA and AMD families.
CPU-only nodes (8 total)
| Node prefix | Count | CPU model | CPU cores/node | RAM/node |
|---|---|---|---|---|
| kwok-cpu-highcore | 2 | AMD EPYC 9965 192-Core | 384 (2x192) | 1536 GiB |
| kwok-cpu-highfreq | 2 | AMD EPYC 9375F 32-Core | 64 (2x32) | 770 GiB |
| kwok-cpu-intensive | 4 | AMD EPYC 9655 96-Core | 192 (2x96) | 1536 GiB |
Total: 41 nodes, 188 GPUs (5 families), ~5800 CPU cores.
Hardware models in simulator
GPU power per device at load fraction g:
P_gpu(g) = IdleW + (PeakW - IdleW) * g^computeGamma
Per-GPU-family physics parameters:
| GPU family | IdleW (W) | PeakW (W) | computeGamma | GPU cap range |
|---|---|---|---|---|
| NVIDIA H100 NVL | 80 | 400 | 1.50 | 200-400 W |
| NVIDIA H100 80GB HBM3 | 120 | 700 | 1.50 | 350-700 W |
| NVIDIA L40S | 60 | 350 | 1.40 | 200-350 W |
| AMD Instinct MI300X | 100 | 750 | 0.85 | 350-750 W |
| AMD Radeon PRO W7900 | 40 | 295 | 1.20 | 200-295 W |
computeGamma controls cap sensitivity: higher gamma = more throughput retained under capping.
At 65% GPU cap: H100 NVL loses ~24.7%, MI300X loses ~38.2% throughput.
Full power-model details: Power Simulator
Run configuration
- Seeds:
3 - Jobs:
200 - Mean inter-arrival:
0.30 s - Time scale:
60x - Timeout:
3600 s - Perf ratio:
25%, GPU ratio:35% - Workload types:
debug_eval,single_gpu_training,cpu_preprocess,cpu_analytics - Policy caps: CPU eco at
65%, GPU eco at65%of peak
Algorithms used
Controller policies
static_partition:hpCount = round(N * 0.40)-> ~16 performance nodes, ~25 eco nodes
queue_aware_v1:baseCount = round(N * 0.40), dynamic adjustment from live perf-pod counthpCount = clamp(max(baseCount, queueNeed), 2, 20, N)
- Downgrade guard:
performance -> ecodeferred while performance-sensitive pods run on node
Results summary
Per-seed results
| Baseline | Seed | Wall (s) | Throughput (jobs/sim-hr) | Energy (kWh sim) | Avg power (W) |
|---|---|---|---|---|---|
| A | 1 | 392.78 | 27.04 | 65.55 | 10013 |
| A | 2 | 218.80 | 49.36 | 35.52 | 9741 |
| A | 3 | 437.64 | 24.27 | 70.60 | 9679 |
| B | 1 | 393.65 | 26.98 | 60.78 | 9265 |
| B | 2 | 216.65 | 49.85 | 33.86 | 9377 |
| B | 3 | 438.61 | 24.21 | 66.41 | 9085 |
| C | 1 | 391.76 | 27.11 | 60.15 | 9213 |
| C | 2 | 217.53 | 49.65 | 34.41 | 9493 |
| C | 3 | 438.16 | 24.24 | 66.34 | 9084 |
Baseline means (3 seeds, all completed)
| Baseline | Mean wall (s) | Mean throughput (jobs/sim-hr) | Mean energy (kWh sim) | Mean cluster power (W) |
|---|---|---|---|---|
| A | 349.7 | 33.56 | 57.22 | 9811 |
| B | 349.6 | 33.68 | 53.68 | 9242 |
| C | 349.1 | 33.67 | 53.63 | 9263 |
Relative to A:
- B: energy -6.2%, throughput +0.4% (negligible)
- C: energy -6.3%, throughput +0.3% (negligible)
Plot commentary
Runtime distribution
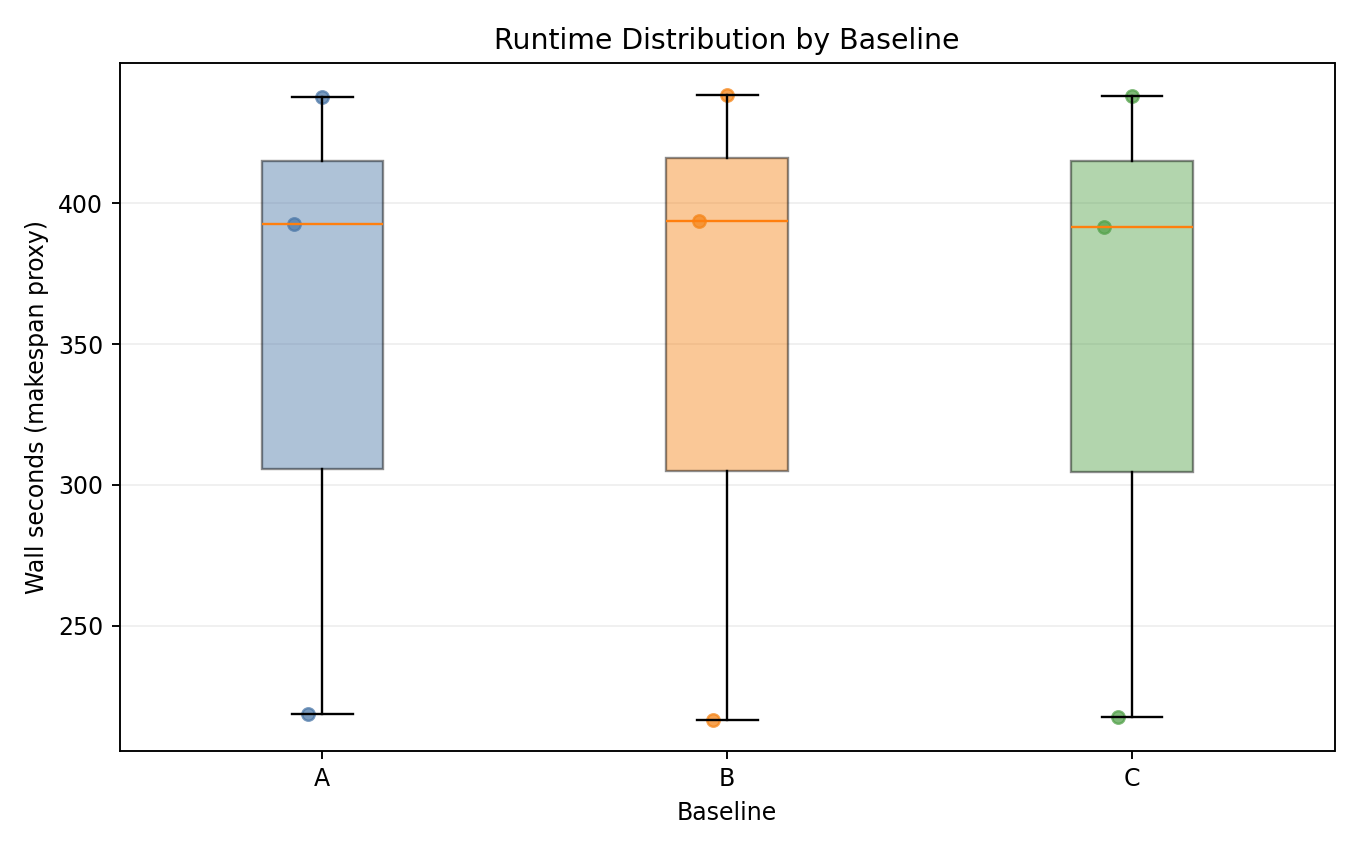
- All three baselines complete within similar wall-time windows across all seeds.
- No incomplete runs - all 9 seeds completed successfully.
Energy vs makespan
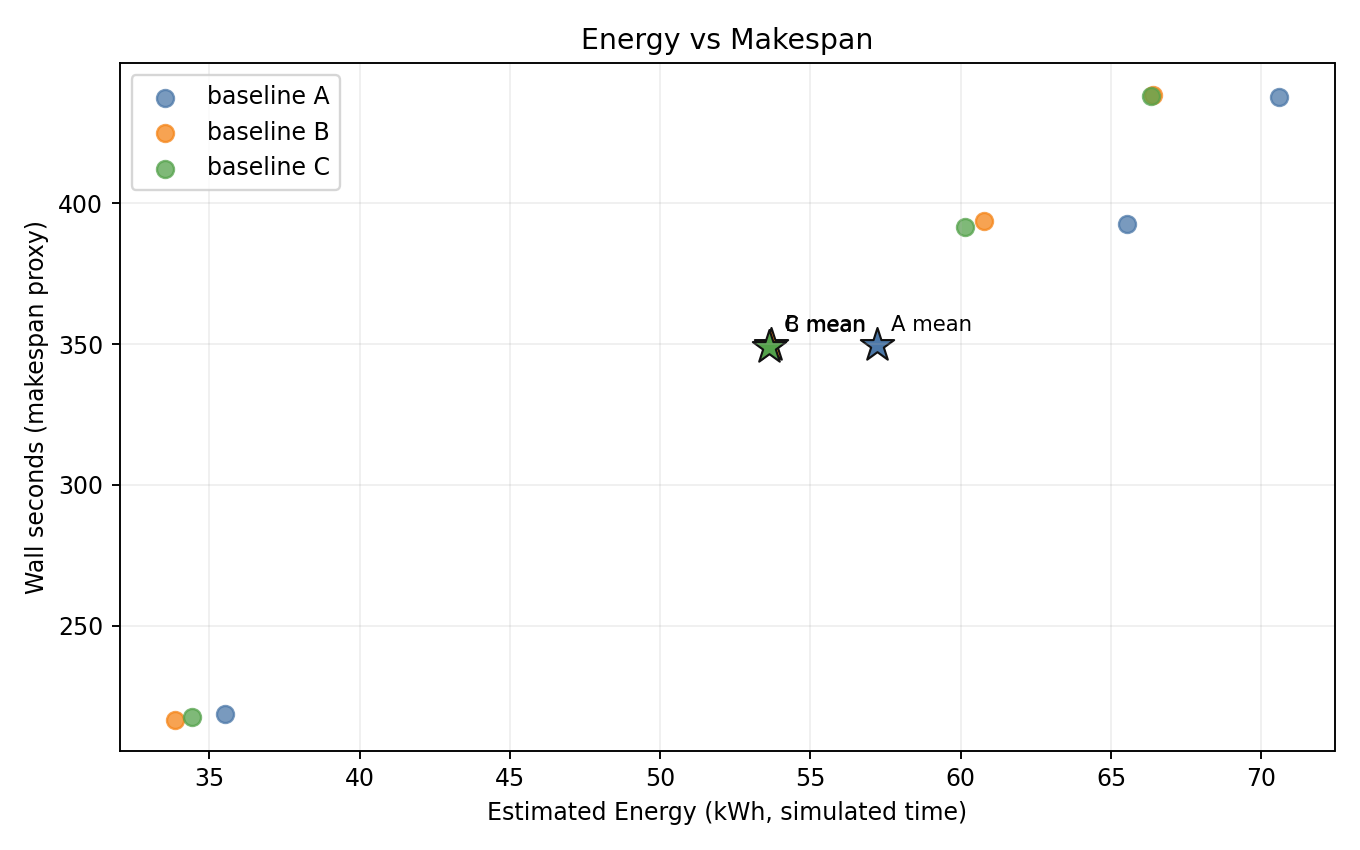
- B and C are consistently shifted to lower energy vs A, with near-identical makespan.
Baseline means
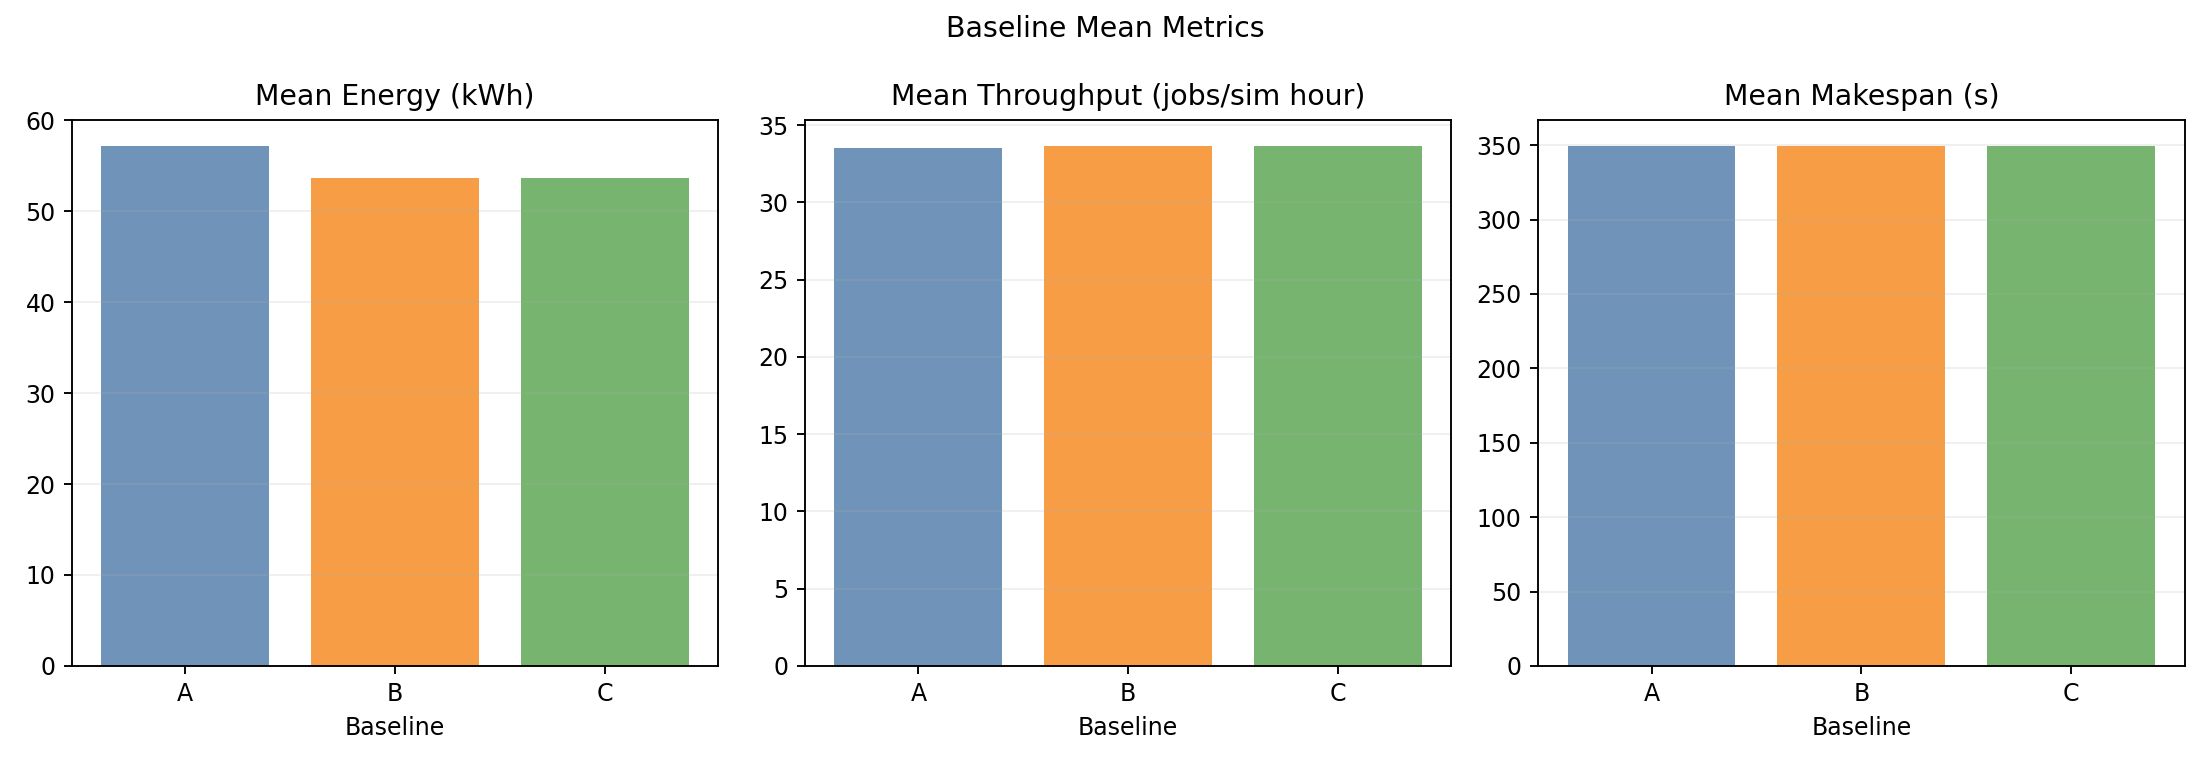
- Throughput and wall-time bars are indistinguishable across baselines.
- Energy bars clearly show B and C both below A by ~6%.
Relative tradeoff vs A
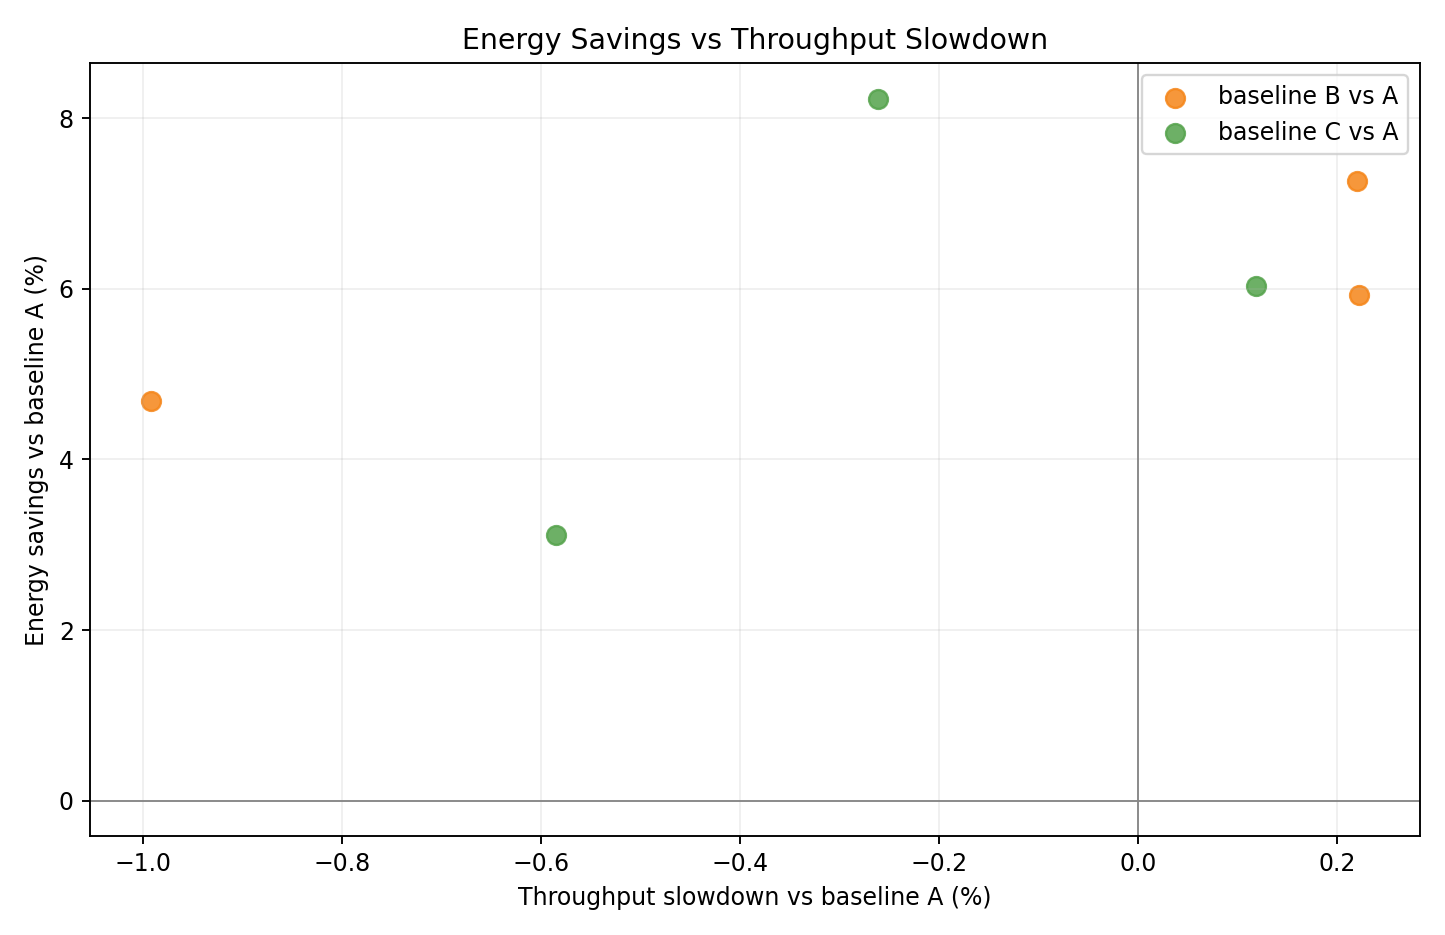
- Per-seed scatter of energy delta vs throughput delta relative to A.
- B and C clusters in the lower-energy region with minimal throughput change.
Relative tradeoff bars vs A
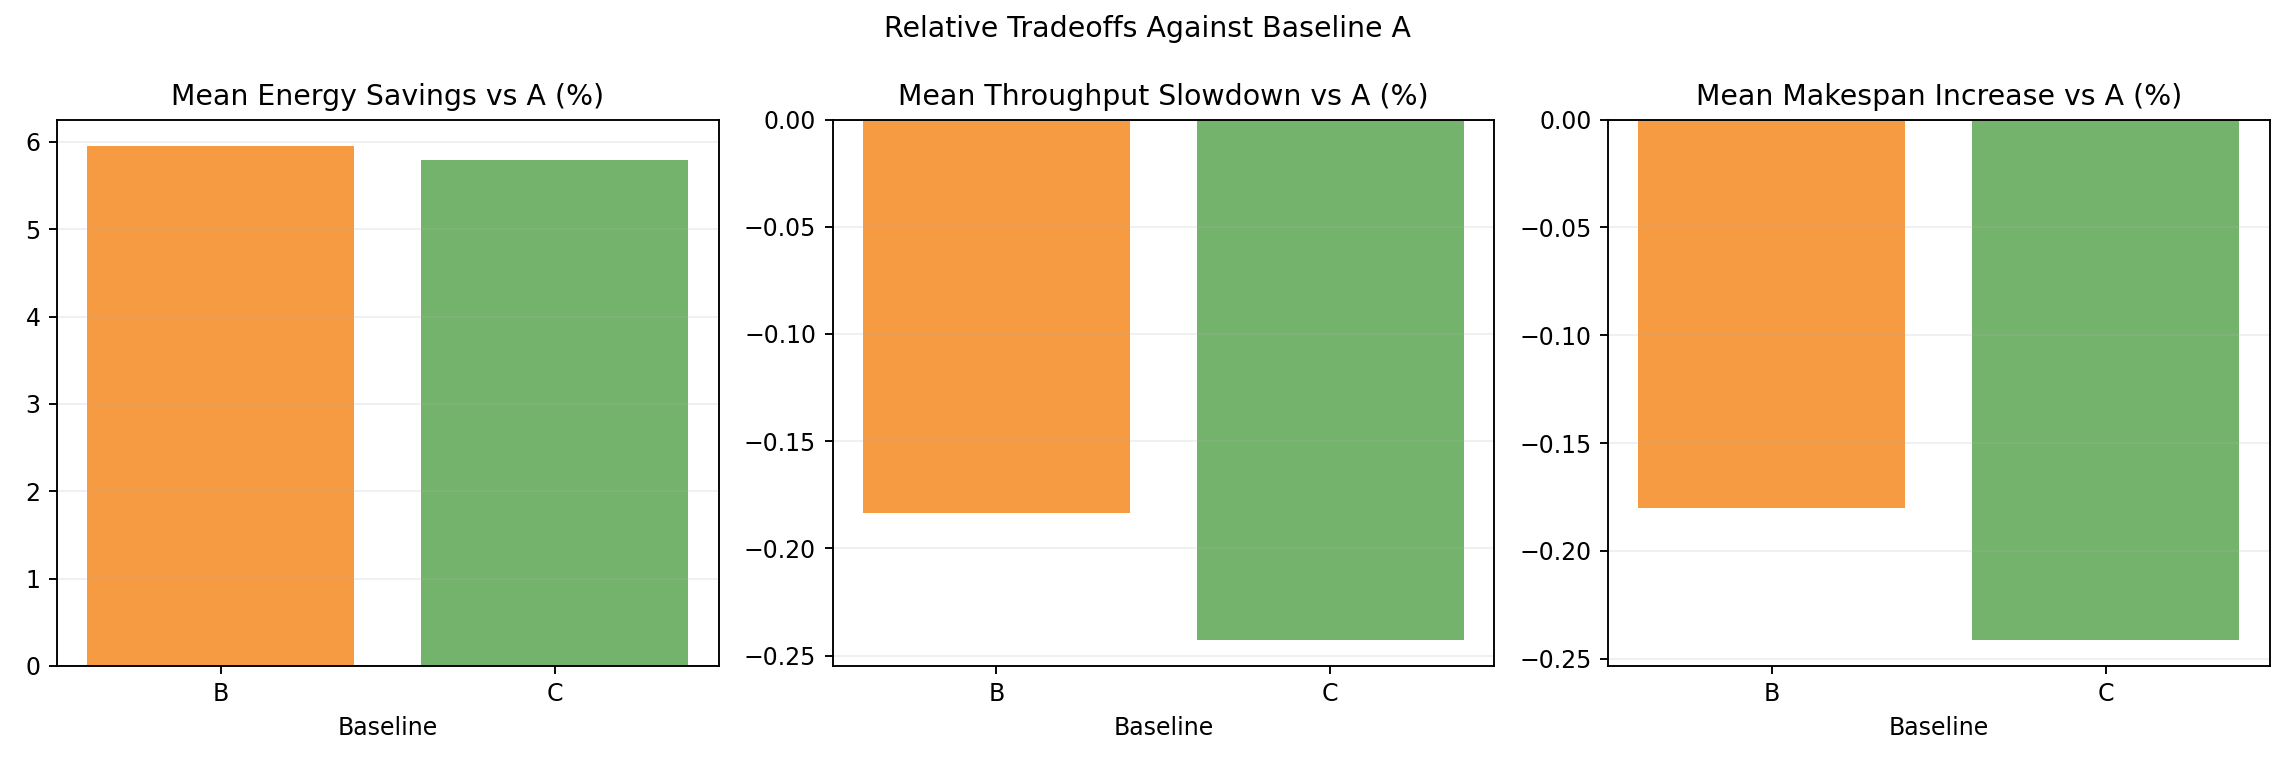
- Mean energy and throughput deltas: B at -6.2% energy / +0.4% throughput, C at -6.3% / +0.3%.
Hardware family tradeoff vs A
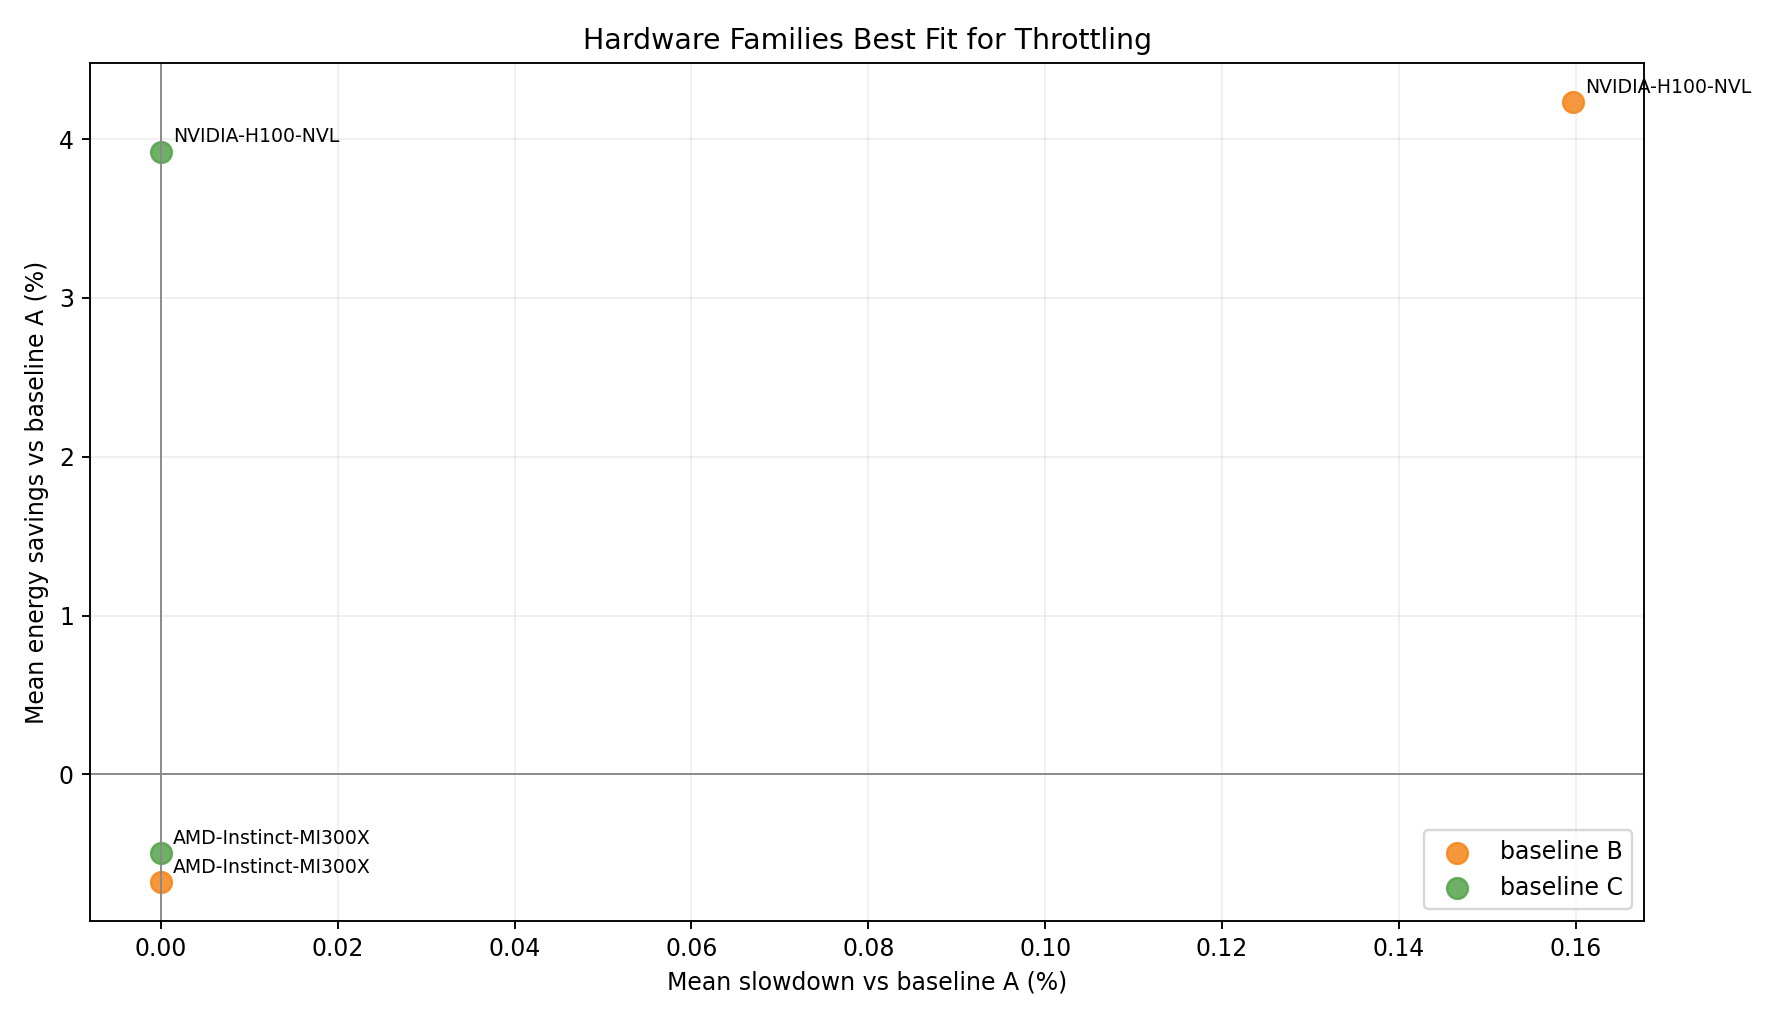
- Per-hardware-family energy and throughput tradeoff under Joulie policies.
Hardware family rankings - baseline B
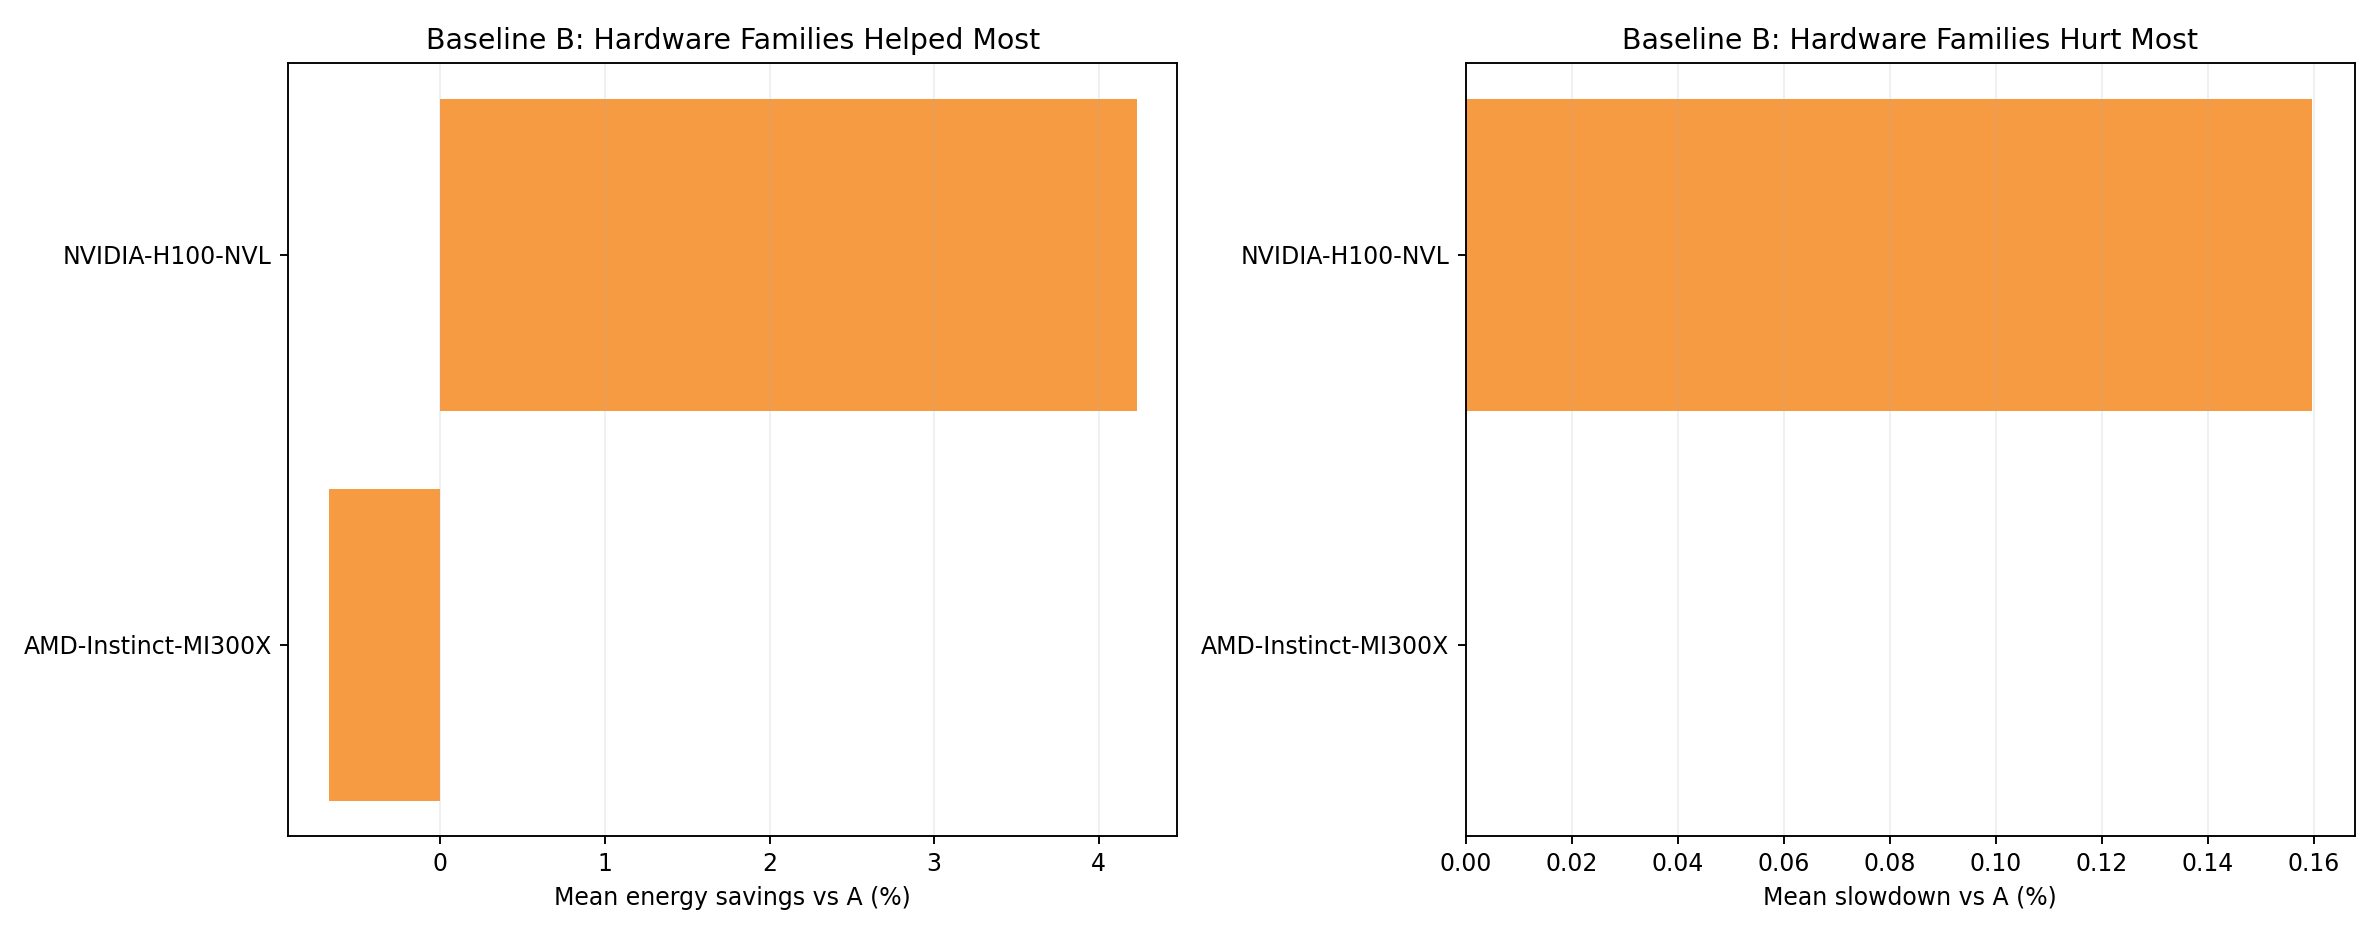
- Per-family energy and throughput under B policy relative to A.
Hardware family rankings - baseline C
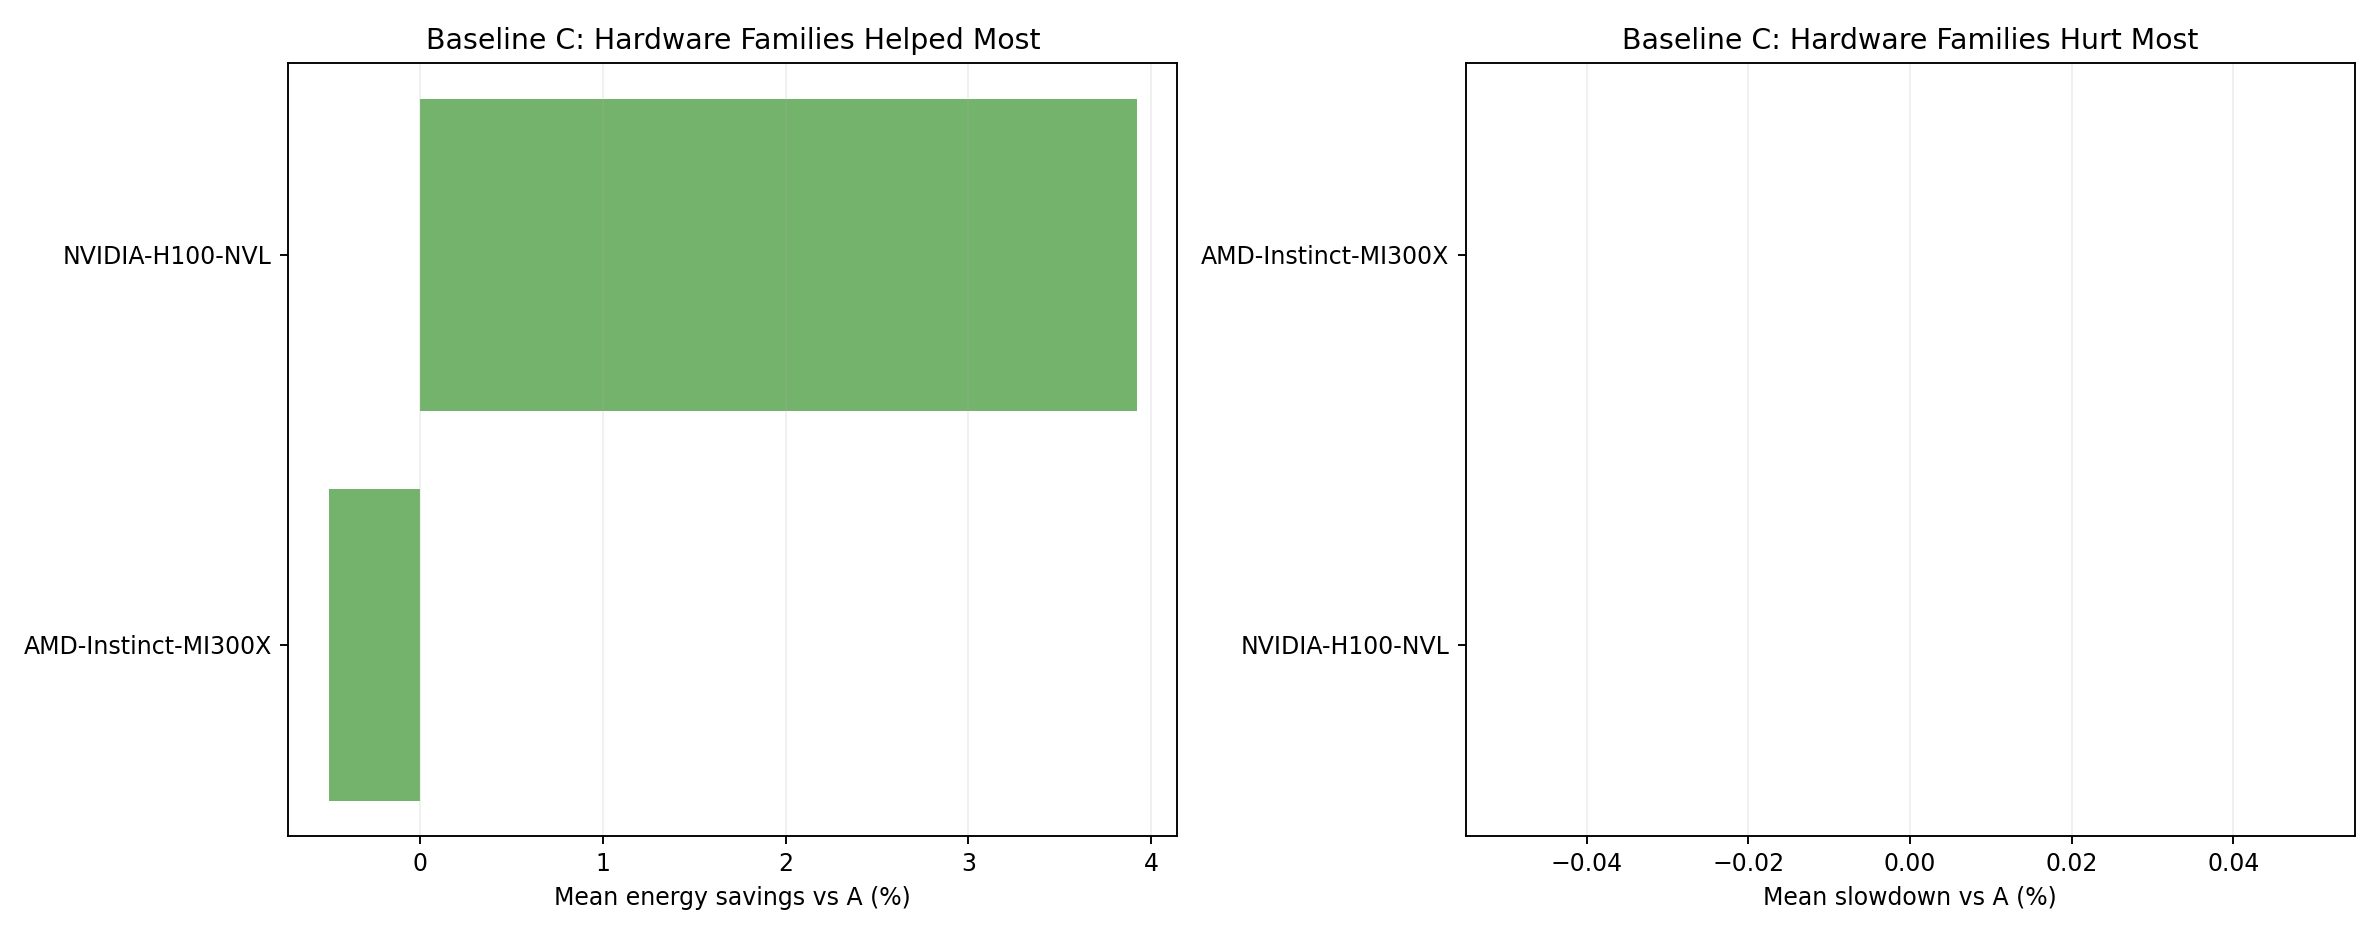
- C shows similar outcomes to B across hardware families.
Completion summary
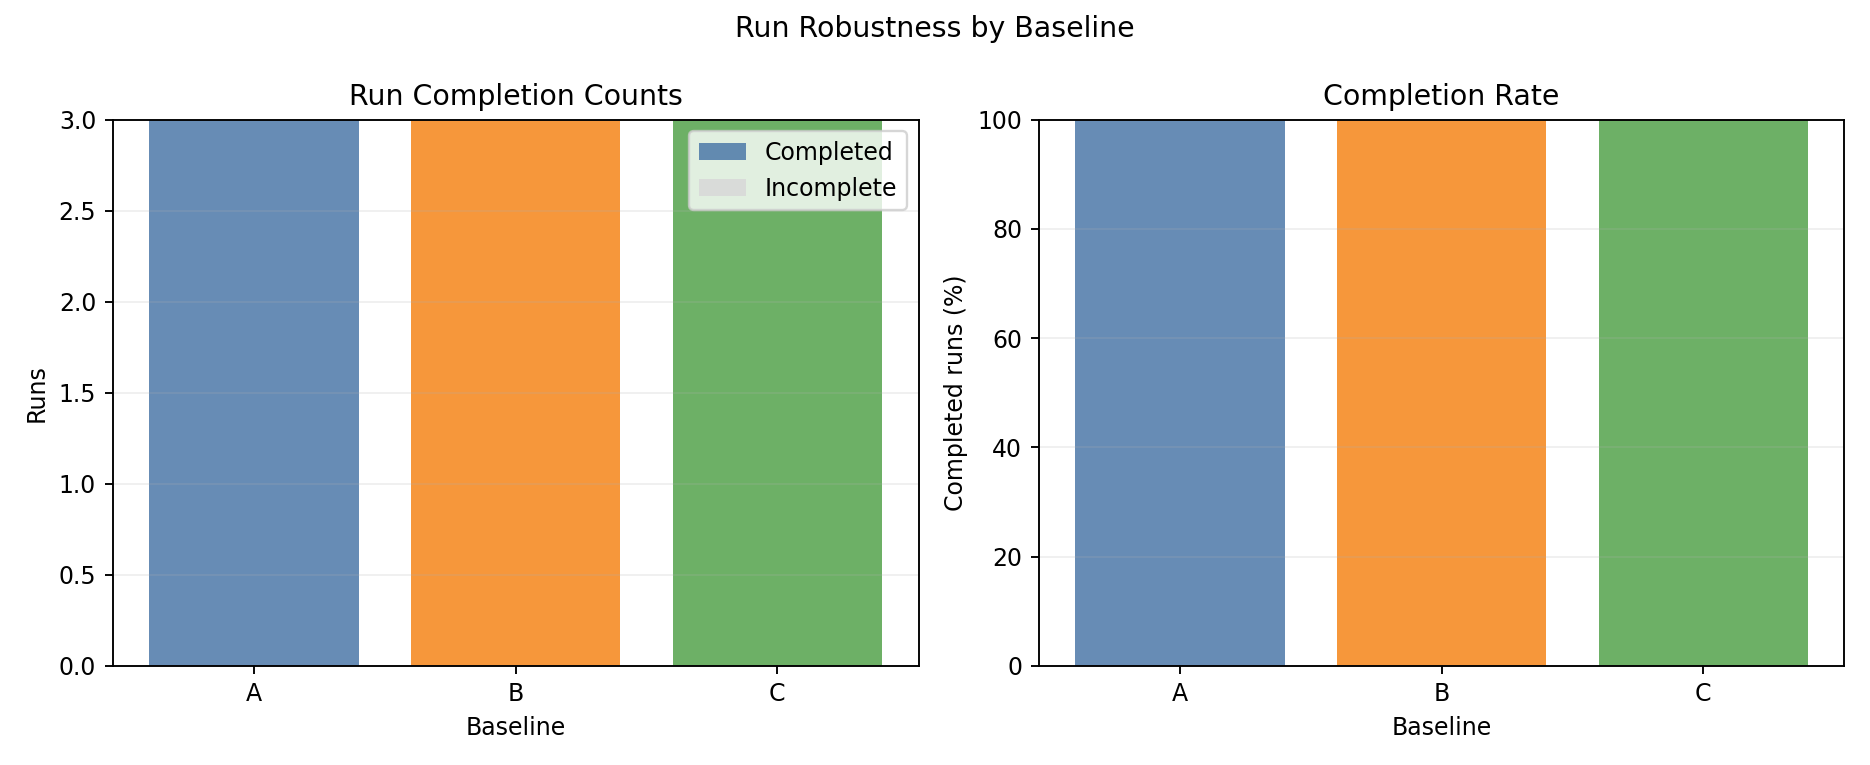
- All baselines achieve 100% completion across all 3 seeds.
Interpretation
Why does Joulie save 6% energy on GPU clusters?
The combination of CPU and GPU eco caps at 65% achieves meaningful energy reduction:
- GPU power caps directly reduce GPU power draw: at 65% cap, each GPU on an eco node draws significantly less power. With 188 GPUs across 33 nodes, even a modest per-GPU savings compounds at scale.
- CPU caps further reduce host power: eco nodes draw less CPU power in addition to GPU savings.
- Throughput preserved: the scheduler distributes performance-sensitive jobs to uncapped performance nodes. The net throughput impact is negligible.
Both policies achieve nearly identical results (~6.2-6.3%) because the workload mix does not create sufficient demand spikes to differentiate queue-aware from static partition.
Best-fit use case
- Joulie achieves -6.2% energy (static) / -6.3% energy (queue-aware) on heterogeneous GPU clusters with negligible throughput impact.
- The key enabler is applying GPU power caps in addition to CPU caps on eco nodes.