Homogeneous H100 NVL Benchmark
This page reports results from the homogeneous H100 NVL cluster benchmark experiment:
Scope
The benchmark compares three baselines on a homogeneous cluster of NVIDIA H100 NVL GPU nodes plus CPU-only nodes:
A: simulator only (Joulie-free)B: Joulie with static partition policyC: Joulie with queue-aware policy
This experiment is designed for a direct comparison with the heterogeneous benchmark: same 41 total nodes, same workload configuration, but all GPU nodes are a single family (H100 NVL) instead of 5 different families.
Experimental setup
Cluster and nodes
- kind control-plane + worker (real control plane)
- 41 managed KWOK nodes: 33 H100 NVL GPU nodes + 8 CPU-only nodes
- Workload pods target KWOK nodes via selector + toleration
Node inventory - detailed cluster composition
GPU nodes (33 total, 264 GPUs) - all NVIDIA H100 NVL
| Node prefix | Count | GPU model | GPUs/node | GPU cap range | Host CPU | CPU cores/node | RAM/node |
|---|---|---|---|---|---|---|---|
| kwok-h100-nvl | 33 | NVIDIA H100 NVL | 8 | 200–400 W | AMD EPYC 9654 96-Core | 192 | 1536 GiB |
All 33 GPU nodes are identical - any GPU job can be scheduled on any GPU node without hardware-family constraints. This is the key architectural difference from experiment 02.
CPU-only nodes (8 total) - identical to experiment 02
| Node prefix | Count | CPU model | CPU cores/node | RAM/node |
|---|---|---|---|---|
| kwok-cpu-highcore | 2 | AMD EPYC 9965 192-Core | 384 (2×192) | 1536 GiB |
| kwok-cpu-highfreq | 2 | AMD EPYC 9375F 32-Core | 64 (2×32) | 770 GiB |
| kwok-cpu-intensive | 4 | AMD EPYC 9655 96-Core | 192 (2×96) | 1536 GiB |
Total: 41 nodes, 264 GPUs (all H100 NVL), ~7100 CPU cores.
Comparison to experiment 02: same node count (41), but exp 03 has 264 GPUs vs exp 02’s 188 GPUs (H100 NVL has 8 GPUs/node, replacing the lower-density mixed families).
Hardware models in simulator
GPU power model:
P_gpu(g) = IdleW + (PeakW - IdleW) * g^computeGamma
Single GPU family - all nodes use identical parameters:
| GPU family | IdleW (W) | PeakW (W) | computeGamma | GPU cap range |
|---|---|---|---|---|
| NVIDIA H100 NVL | 80 | 400 | 1.50 | 200–400 W |
At 80% GPU cap: loses 1 - 0.8^(1/1.50) ≈ 13.5% GPU throughput.
H100 NVL idle power floor: 80 W/GPU × 264 GPUs = 21,120 W - this is the dominant base cluster power draw.
Full power-model details: Power Simulator
Run configuration
Identical to experiment 02 for a direct comparison:
- Seeds:
3 - Mean inter-arrival:
0.12 s - Time scale:
60× - Timeout:
14400 s - Perf ratio:
15%, eco ratio:0%, GPU ratio:45% - Workload types:
debug_eval,single_gpu_training,cpu_preprocess,cpu_analytics- Note:
distributed_trainingandparameter_server_trainingwere present in the archived run but removed from future benchmarks
- Note:
- Policy caps: CPU eco at
80%, GPU eco at80%of peak
Algorithms used
Controller policies
static_partition:hpCount = round(N * 0.45)→ ~18 performance nodes, ~23 eco nodes
queue_aware_v1:baseCount = round(N * 0.50), dynamic adjustment from live perf-pod counthpCount = clamp(max(baseCount, queueNeed), 2, 10, N)
- Downgrade guard:
performance → ecodeferred while performance-sensitive pods run on node
Results summary
Per-seed results
| Baseline | Seed | Wall (s) | Throughput (jobs/sim-hr) | Energy (kWh sim) | Avg power (W) | Status |
|---|---|---|---|---|---|---|
| A | 1 | 14515 | 11.25 | - | - | INCOMPLETE (gang deadlock) |
| A | 2 | 1817.9 | 91.85 | 1085.08 | 35813 | completed |
| A | 3 | 1979.5 | 83.41 | 1308.35 | 39656 | completed |
| B | 1 | 2237.0 | 72.98 | 1332.40 | 35738 | completed |
| B | 2 | 2031.0 | 82.21 | 1232.98 | 36424 | completed |
| B | 3 | 2138.6 | 77.21 | 1378.89 | 38686 | completed |
| C | 1 | 2355.3 | 69.32 | 1506.83 | 38386 | completed |
| C | 2 | 1815.6 | 91.97 | 1078.41 | 35637 | completed |
| C | 3 | 2117.7 | 77.97 | 1384.26 | 39220 | completed |
Baseline means (seeds 2+3 for A, all 3 seeds for B and C)
| Baseline | Mean wall (s) | Mean throughput (jobs/sim-hr) | Mean energy (kWh sim) | Mean cluster power (W) |
|---|---|---|---|---|
| A | 1898.7 | 87.63 | 1196.7 | 37735 |
| B | 2135.5 | 77.47 | 1314.8 | 36949 |
| C | 2096.2 | 79.75 | 1323.2 | 37748 |
Relative to A (seeds 2+3 fair comparison):
- B: energy +9.1%, throughput −8.9%
- C: energy +2.9%, throughput −3.1%
Both Joulie policies use more energy than the no-Joulie baseline. See interpretation below.
Plot commentary
Runtime distribution
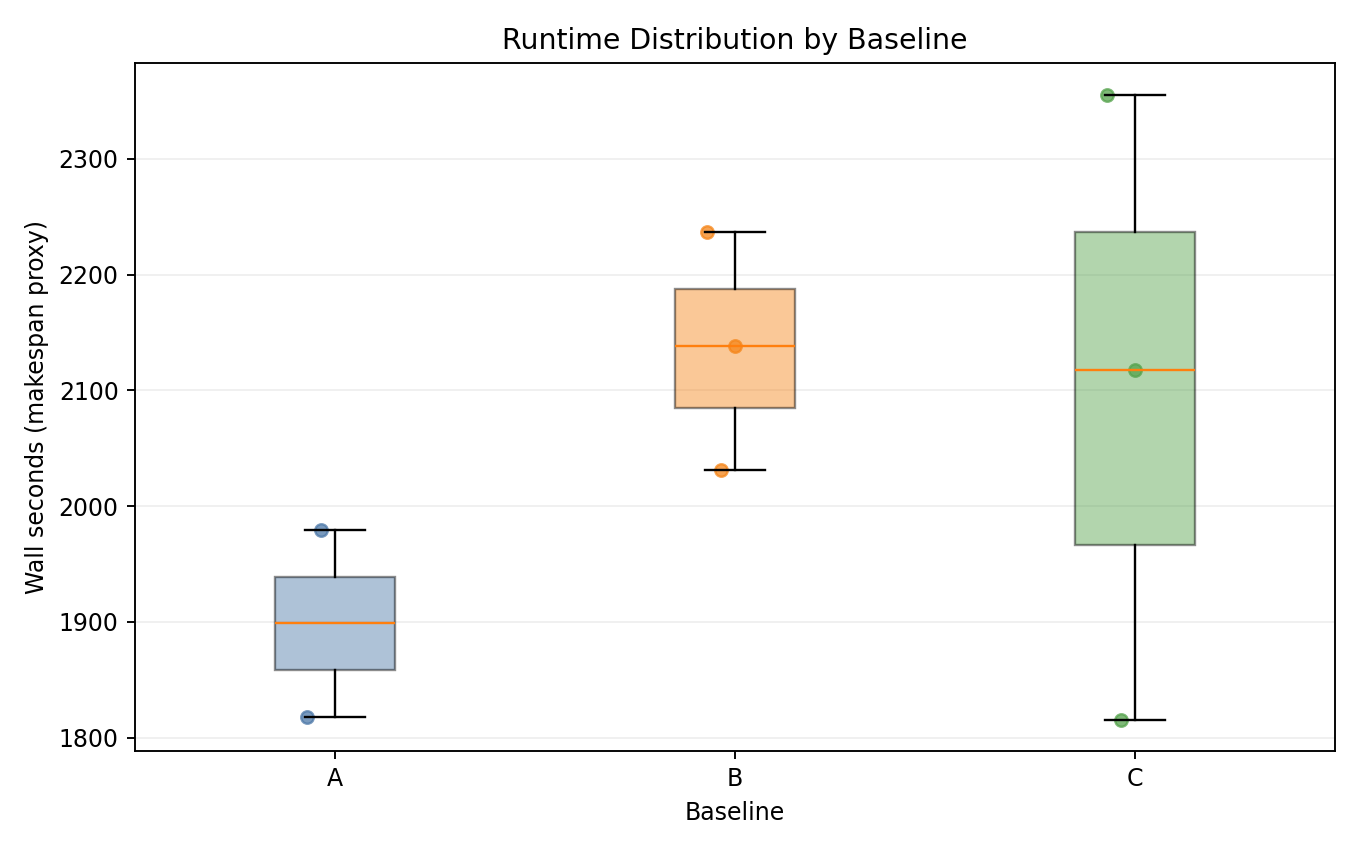
- B and C are consistently slower than A in completed seeds - wall time increases due to CPU throttling extending GPU jobs.
- C shows high variance: seed 1 (2355 s) vs seed 2 (1816 s).
Energy vs makespan
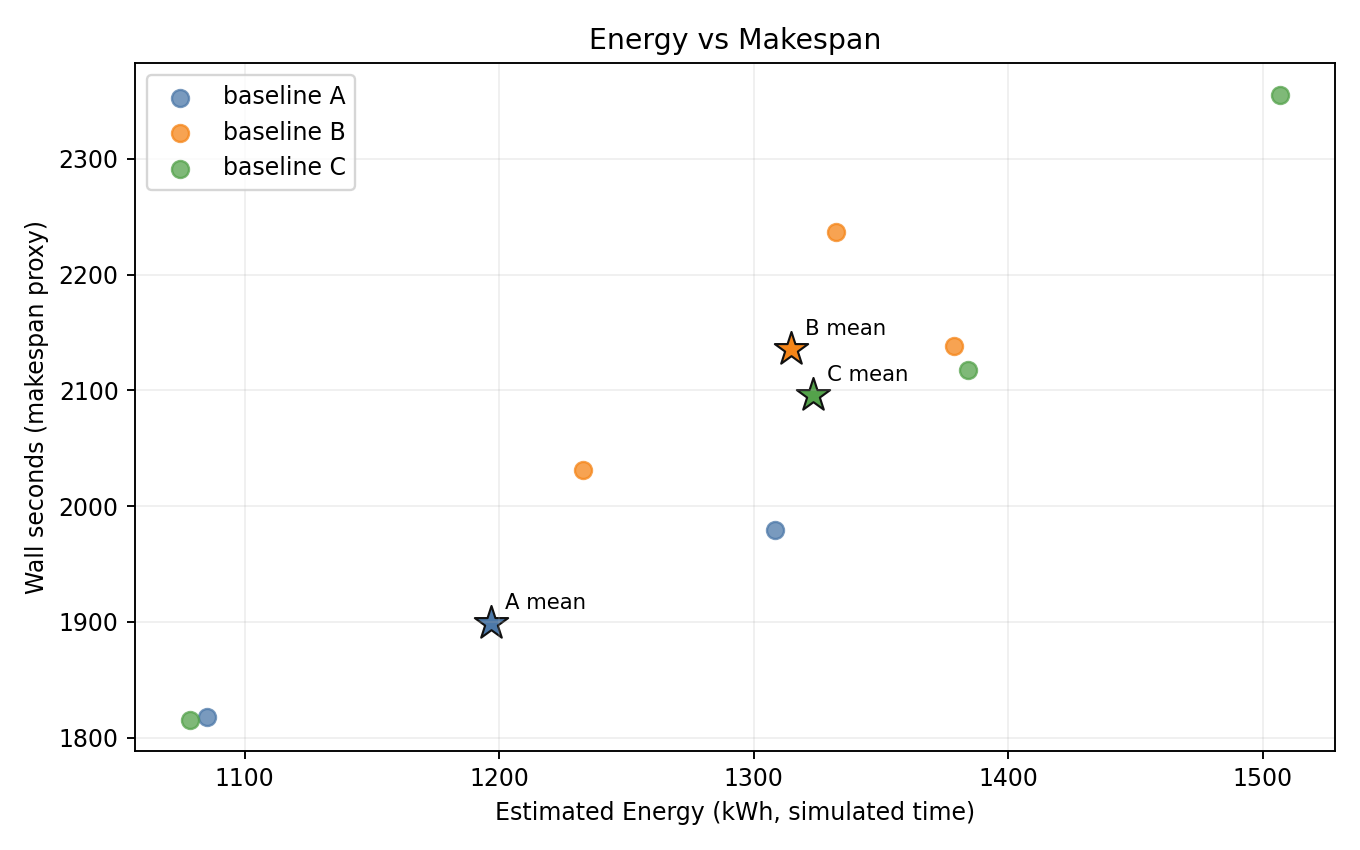
- B and C are shifted to higher energy and higher wall time vs A - energy regression is clearly visible.
- A (seeds 2+3) is the most energy-efficient baseline.
Baseline means
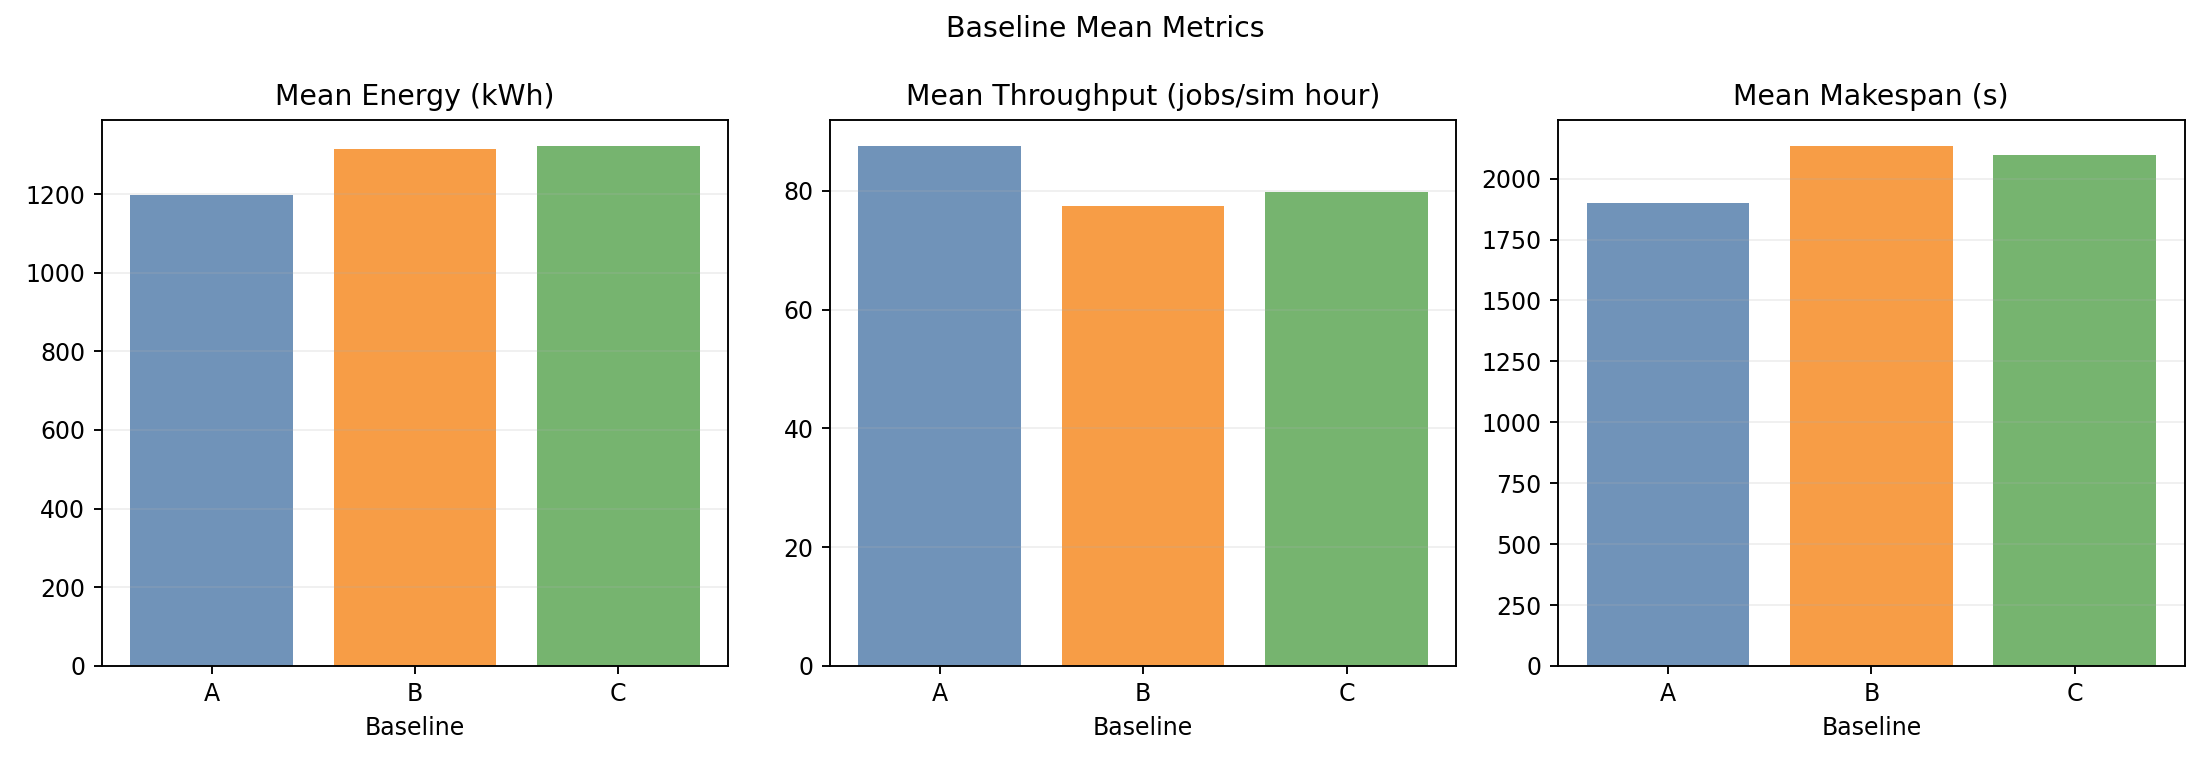
- Wall-time and throughput bars clearly separate: B and C are slower than A.
- Energy bars confirm B (+9.1%) and C (+2.9%) both regress vs A.
Relative tradeoff vs A
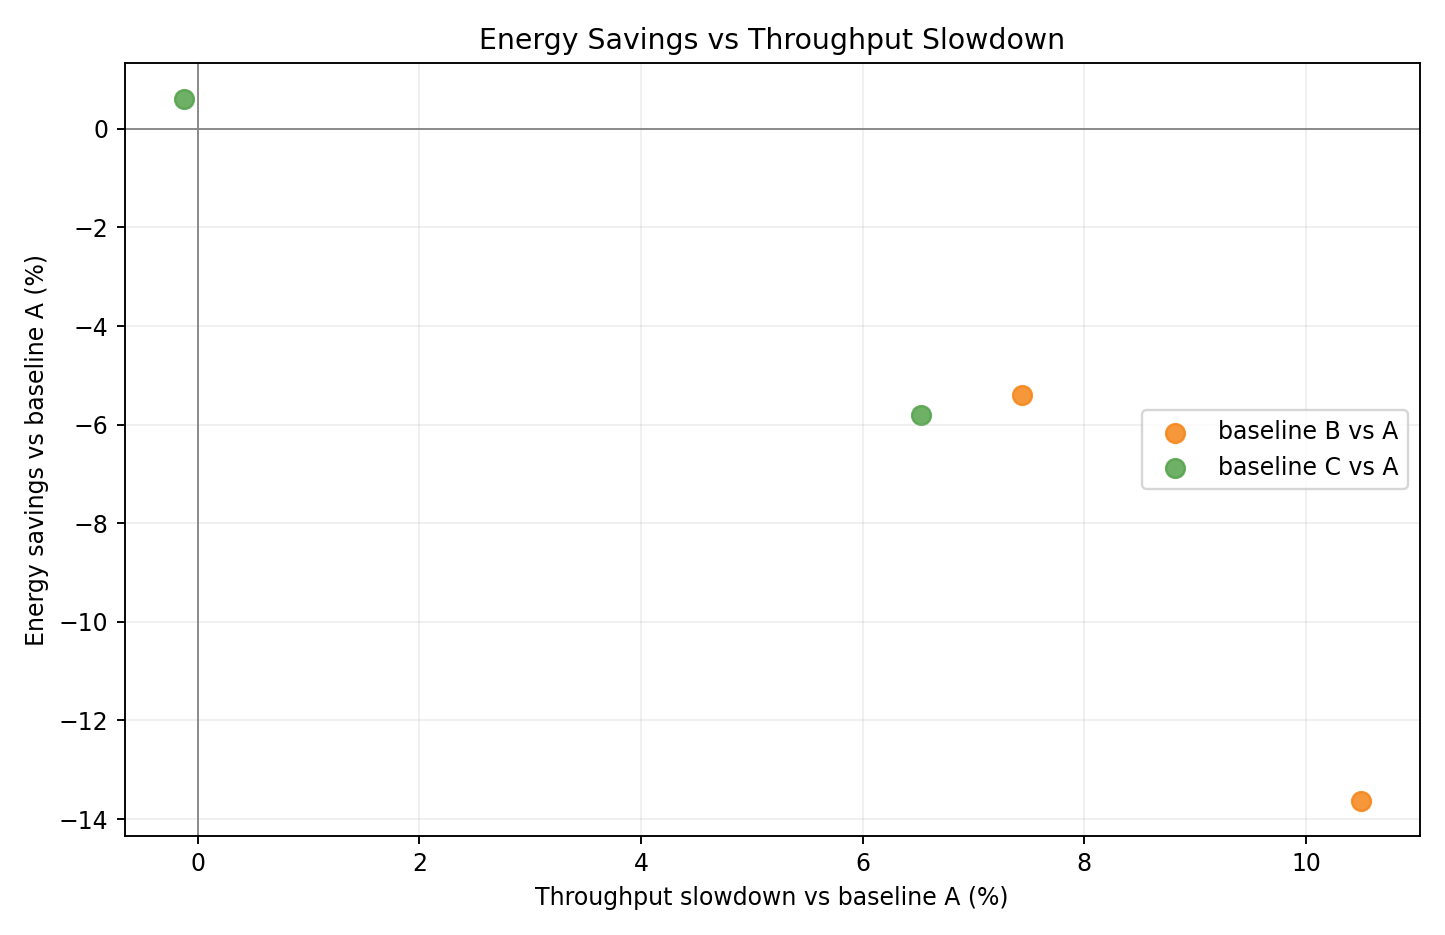
- Per-seed scatter of energy delta vs throughput delta relative to A.
- B seeds cluster at high energy loss / low throughput; C seeds show smaller regression.
Relative tradeoff bars vs A
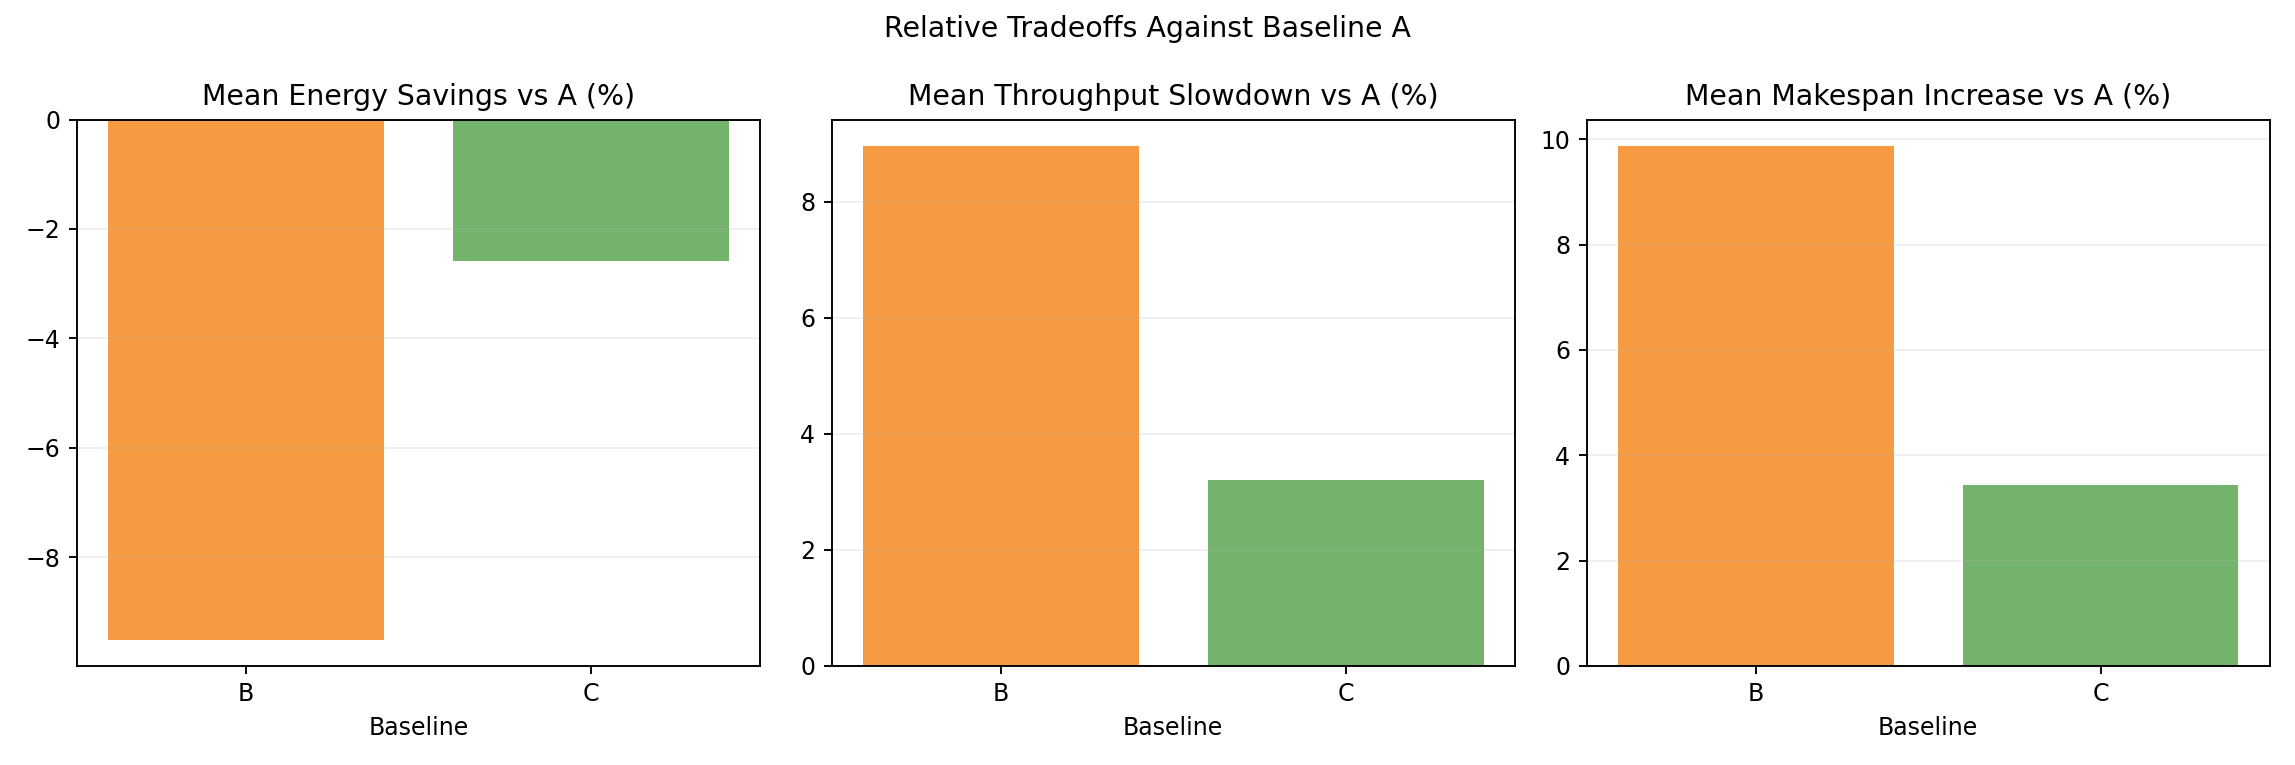
- Mean energy and throughput deltas: B at +9.1% / -8.9%, C at +2.9% / -3.1%.
- Queue-aware adaptivity (C) substantially reduces the energy regression vs static partition (B).
Hardware family tradeoff vs A
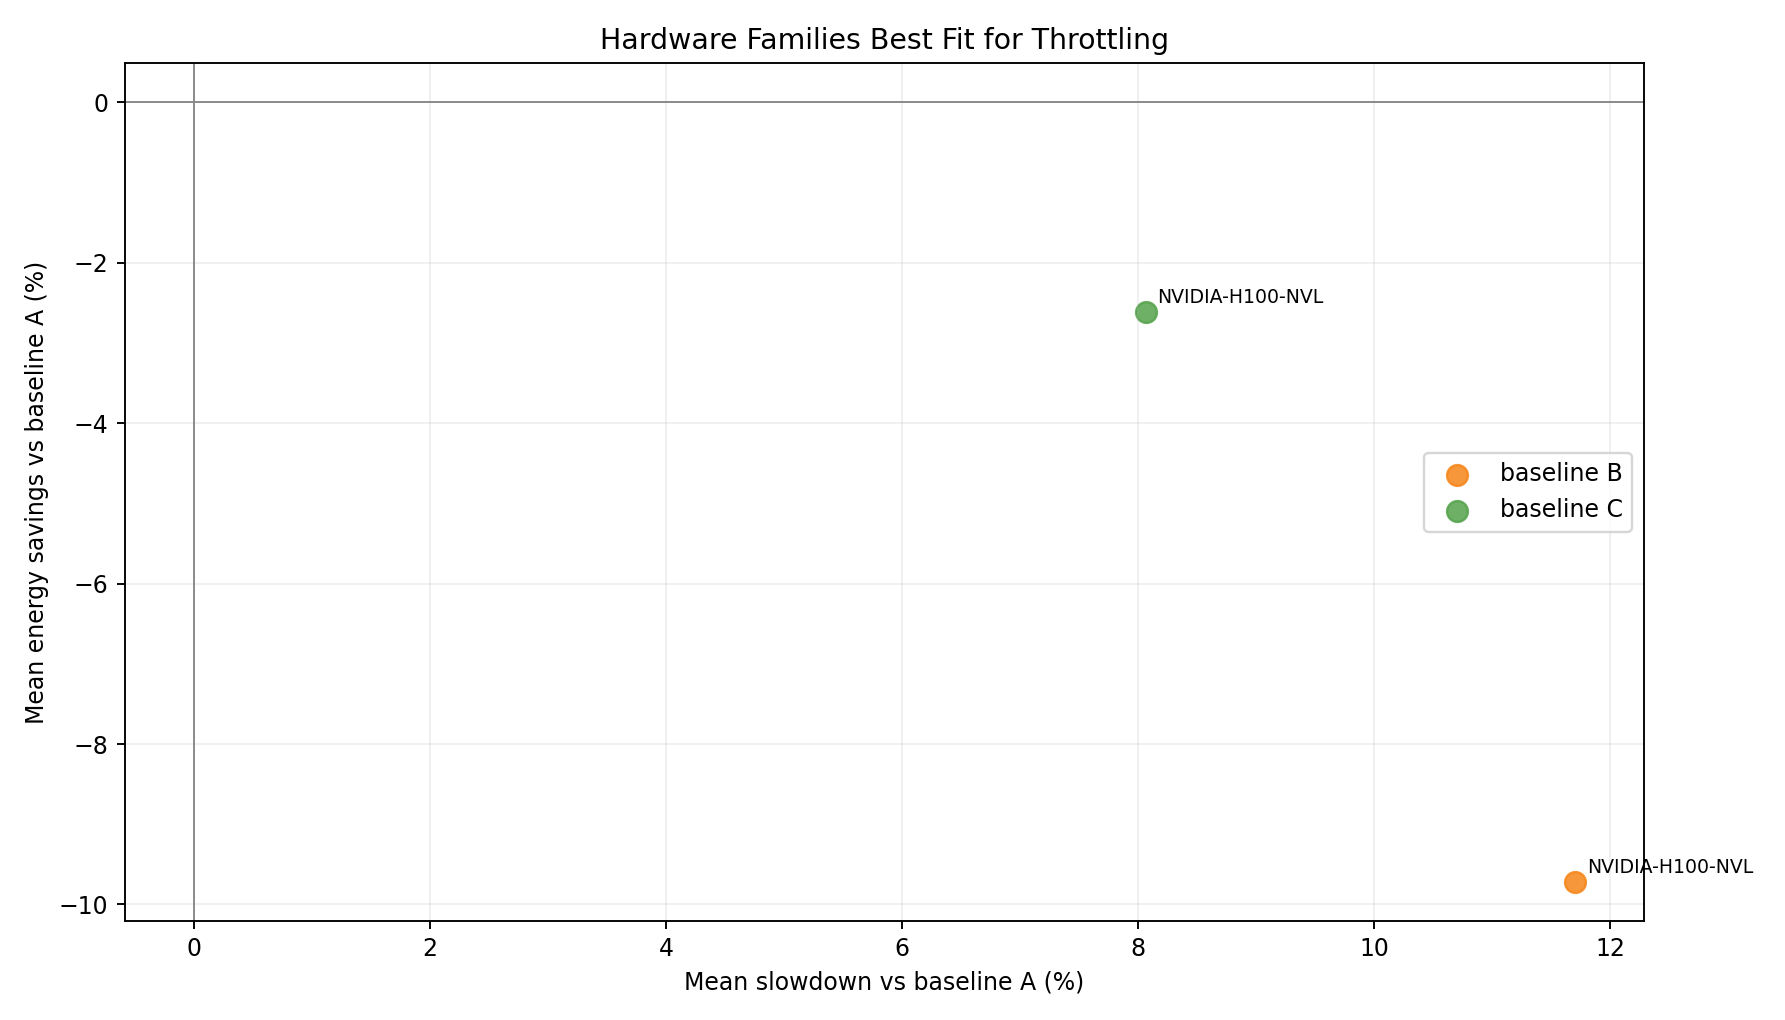
- Single GPU family; both B and C land above A in energy - uniform H100 NVL penalizes the CPU-throttling approach at scale.
Hardware family rankings - baseline B
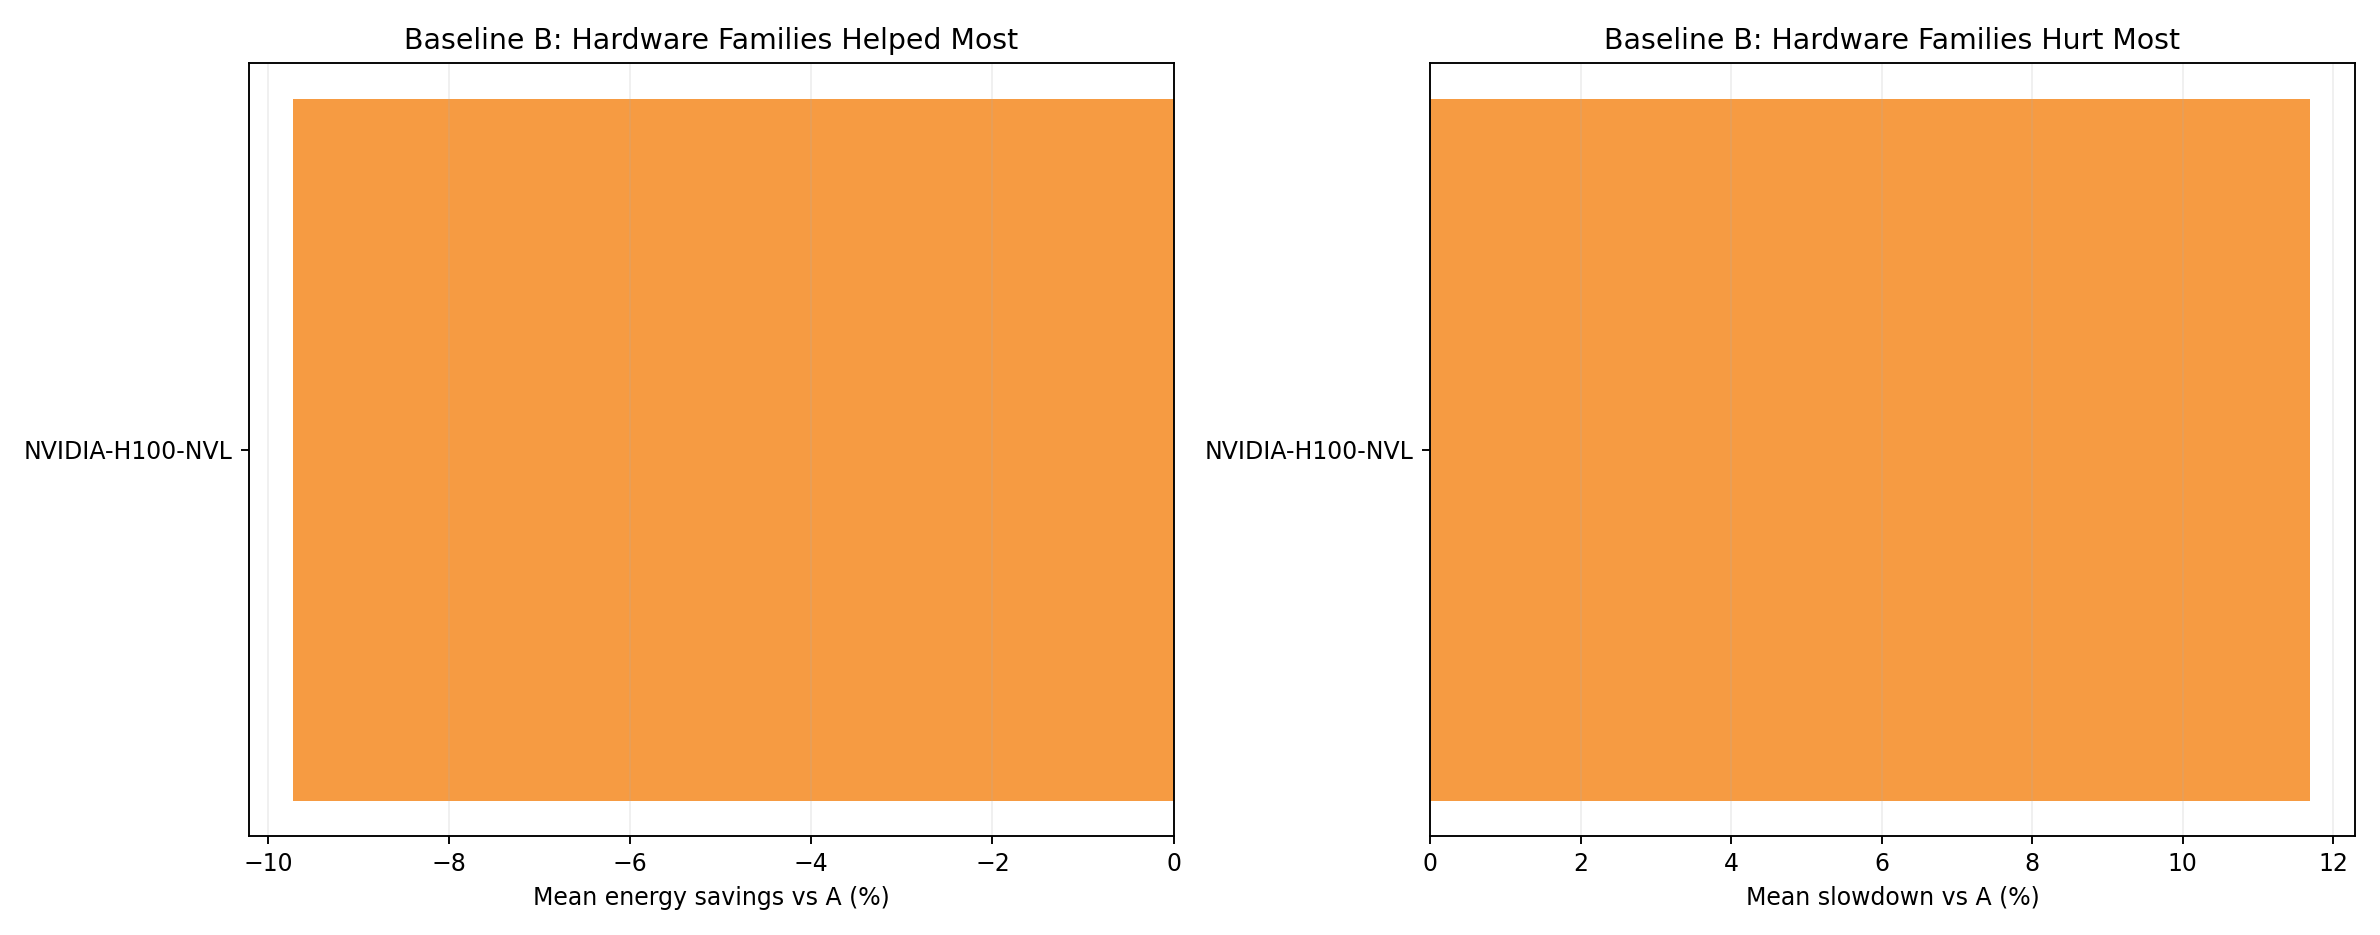
- H100 NVL is the only GPU family. Under B, energy clearly increases and throughput falls vs A.
Hardware family rankings - baseline C
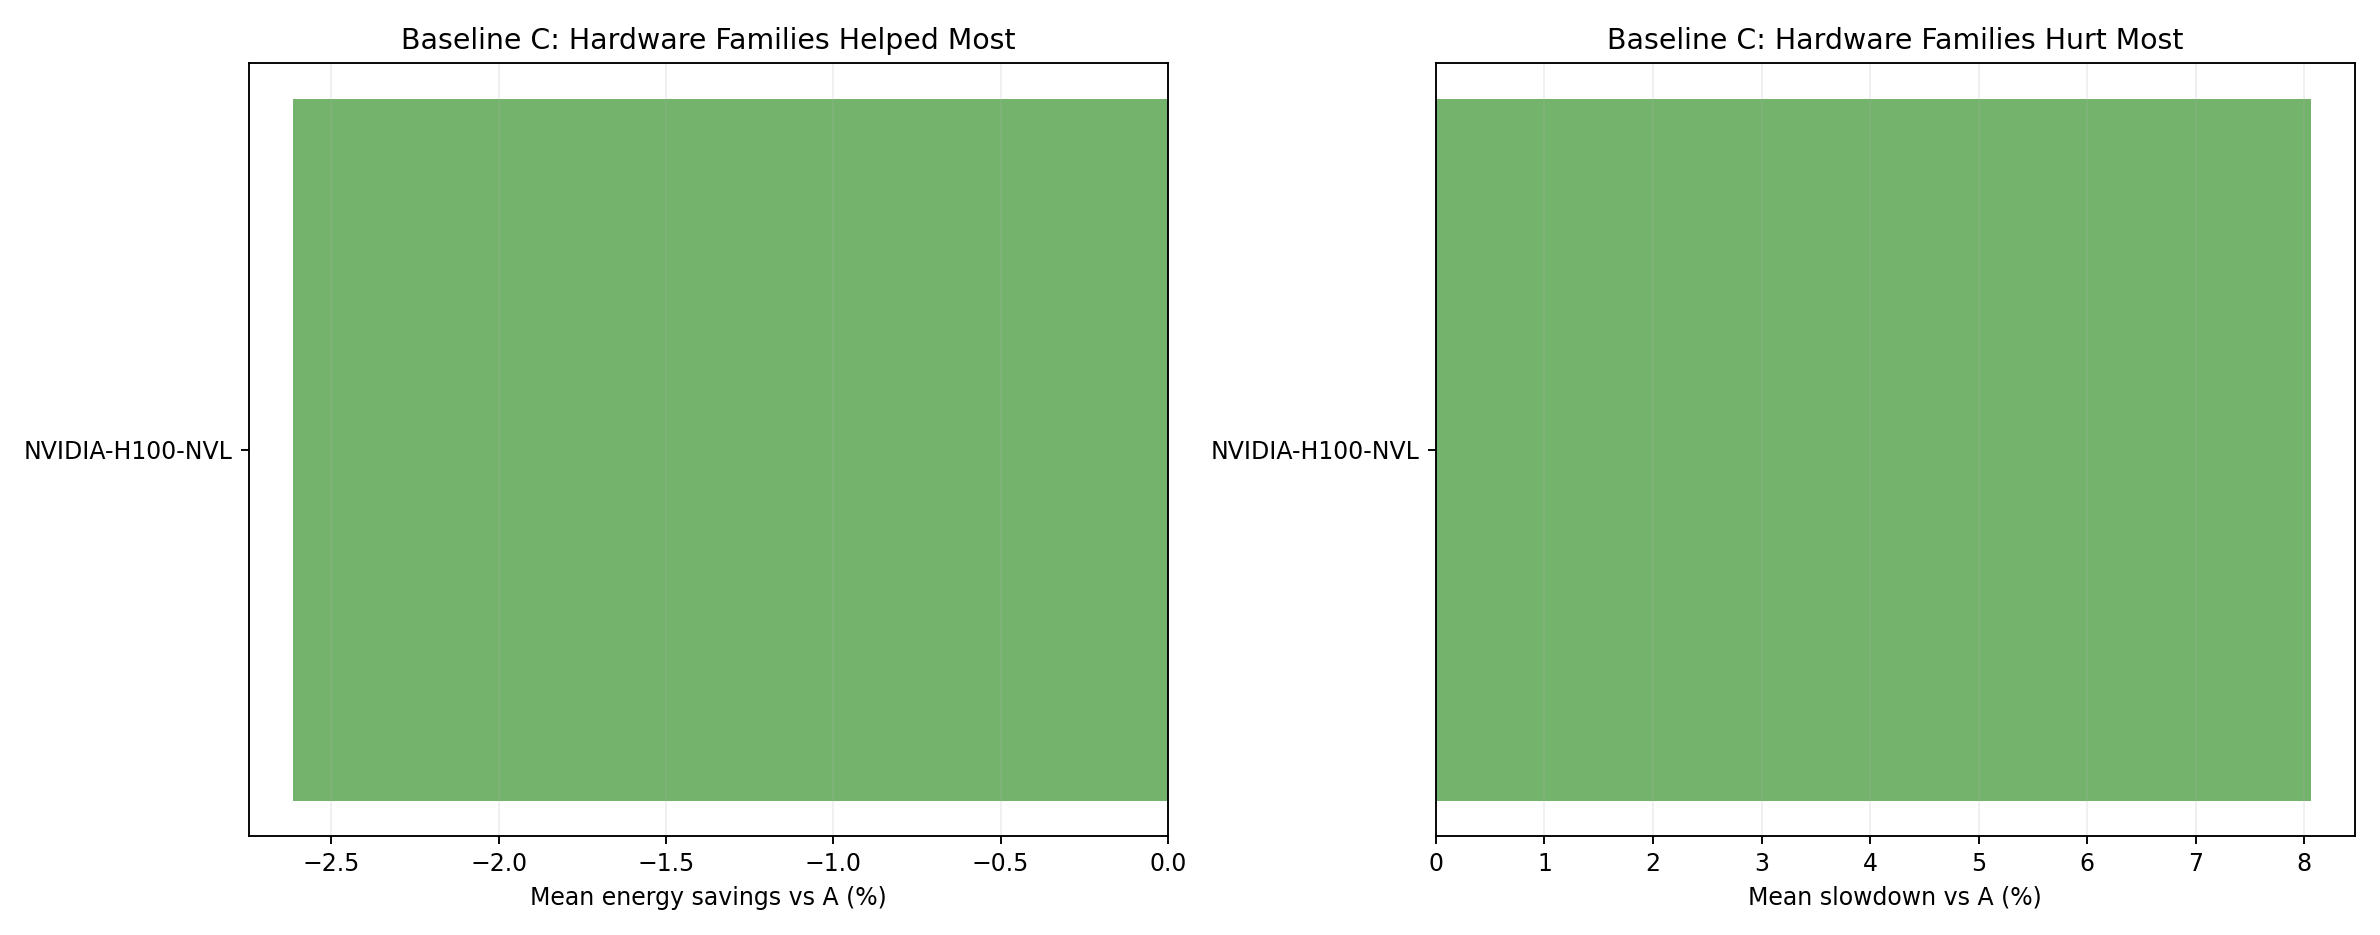
- C shows a smaller H100 NVL energy regression than B, confirming queue-aware adaptivity reduces idle accumulation.
Completion summary
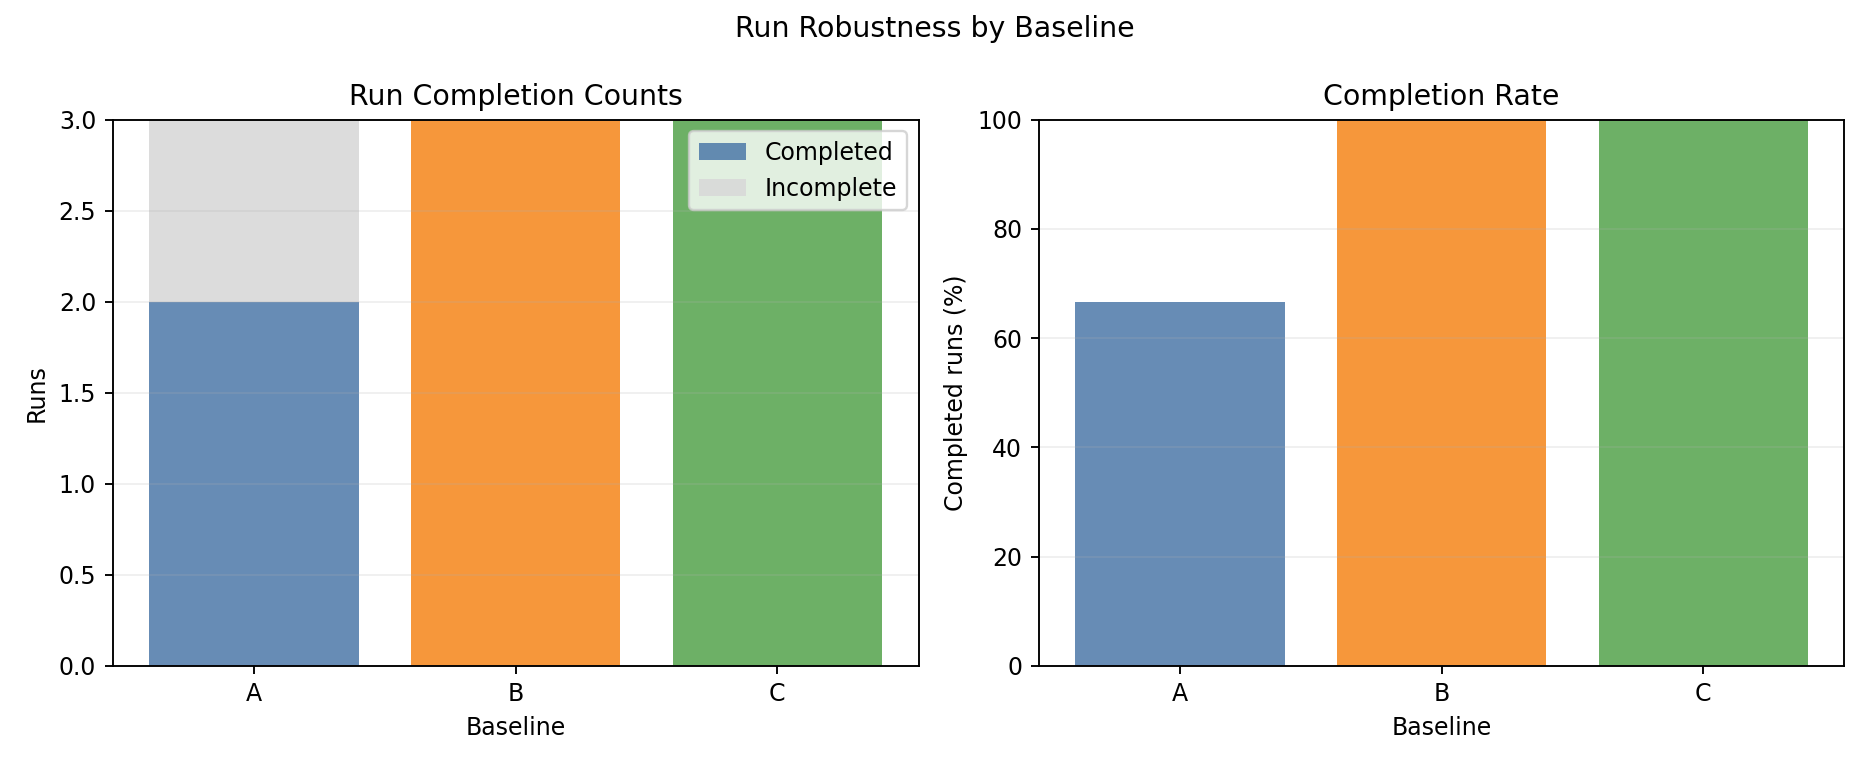
- B and C achieve 100% completion vs A’s 66.7% (1 seed gang deadlock).
- Unlike experiment 02, only A fails - homogeneous scheduling flexibility helps B and C break the deadlock.
Gang scheduling deadlock (seed 1, baseline A)
Baseline A timed out in seed 1 with 1796 pods permanently stuck. Root cause: same gang-deadlock mechanism as experiment 02 (multi-pod jobs without gang scheduler). Unlike experiment 02, baselines B and C both completed seed 1 here - the homogeneous cluster offers more scheduling flexibility (no GPU-family constraints), making operator reconcile cycles more effective at breaking circular allocation.
Multi-pod job types have been removed from all future benchmarks.
Interpretation
Why is the energy regression larger here than in experiment 02?
The energy increase is stronger in exp 03 (B: +9.1% vs exp 02’s +1.8%) for the same underlying reason - amplified:
More GPUs, all at H100 NVL idle power: 264 GPUs × 80 W idle = 21,120 W base floor, vs exp 02’s mixed ~15,000 W. Any extension of job duration accumulates more absolute idle energy.
No low-sensitivity GPU families to dilute the effect: In exp 02, MI300X and W7900 have different power profiles that partially offset H100 effects. In exp 03, all GPUs have identical parameters - CPU throttling via
cpuFeedFactorapplies uniformly at scale.CPU savings remain negligible: CPU-only nodes represent <3% of total cluster energy. Capping them saves a few kWh sim per run; extending each GPU job by 10% adds ~120 kWh sim.
Why does C significantly outperform B?
Queue-aware (C) reduces eco-node count dynamically during GPU-heavy phases, returning more nodes to uncapped performance mode. Static (B) maintains a fixed 23-node eco block for the entire run regardless of workload composition. On large GPU clusters where the duration-extension penalty is severe, this adaptivity meaningfully matters: C at +2.9% vs B at +9.1%.
Key finding
Uniform CPU cap policy is counterproductive on homogeneous H100 NVL clusters. The energy cost of extending GPU job duration via cpuFeedFactor far exceeds any CPU power savings. The correct approach is GPU power cap control - not CPU frequency reduction - applied only when GPU throughput loss is less than idle energy avoided.
Best-fit use case
- Joulie with current policy increases energy by 2.9–9.1% on homogeneous H100 NVL clusters.
queue_aware_v1is significantly better thanstatic_partition- but both are worse than doing nothing.- Next step: GPU-cap-aware policy that does not throttle CPU on GPU nodes, and applies GPU caps only when energetically beneficial.