Heterogeneous GPU Cluster Benchmark
This page reports results from the heterogeneous GPU cluster benchmark experiment:
Scope
The benchmark compares three baselines on a heterogeneous cluster mixing 5 distinct GPU hardware families plus CPU-only nodes:
A: simulator only (Joulie-free)B: Joulie with static partition policyC: Joulie with queue-aware policy
Experimental setup
Cluster and nodes
- kind control-plane + worker (real control plane)
- 41 managed KWOK nodes: 33 GPU nodes + 8 CPU-only nodes
- Workload pods target KWOK nodes via selector + toleration
Node inventory - detailed cluster composition
This is a heterogeneous GPU cluster mixing 5 distinct GPU hardware families across 33 GPU nodes, plus 8 CPU-only nodes.
GPU nodes (33 total, 188 GPUs)
| Node prefix | Count | GPU model | GPUs/node | GPU cap range | Host CPU | CPU cores/node |
|---|---|---|---|---|---|---|
| kwok-h100-nvl | 12 | NVIDIA H100 NVL | 8 | 200–400 W | AMD EPYC 9654 96-Core | 192 |
| kwok-h100-sxm | 6 | NVIDIA H100 80GB HBM3 | 4 | 350–700 W | Intel Xeon Gold 6530 | 64 |
| kwok-l40s | 7 | NVIDIA L40S | 4 | 200–350 W | AMD EPYC 9534 64-Core | 128 |
| kwok-mi300x | 2 | AMD Instinct MI300X | 8 | 350–750 W | AMD EPYC 9534 64-Core | 128 |
| kwok-w7900 | 6 | AMD Radeon PRO W7900 | 4 | 200–295 W | AMD EPYC 9534 64-Core | 128 |
GPU count summary: 96 + 24 + 28 + 16 + 24 = 188 GPUs total across NVIDIA and AMD families.
CPU-only nodes (8 total)
| Node prefix | Count | CPU model | CPU cores/node | RAM/node |
|---|---|---|---|---|
| kwok-cpu-highcore | 2 | AMD EPYC 9965 192-Core | 384 (2×192) | 1536 GiB |
| kwok-cpu-highfreq | 2 | AMD EPYC 9375F 32-Core | 64 (2×32) | 770 GiB |
| kwok-cpu-intensive | 4 | AMD EPYC 9655 96-Core | 192 (2×96) | 1536 GiB |
Total: 41 nodes, 188 GPUs (5 families), ~5800 CPU cores.
Hardware models in simulator
GPU power per device at load fraction g:
P_gpu(g) = IdleW + (PeakW - IdleW) * g^computeGamma
Per-GPU-family physics parameters:
| GPU family | IdleW (W) | PeakW (W) | computeGamma | GPU cap range |
|---|---|---|---|---|
| NVIDIA H100 NVL | 80 | 400 | 1.50 | 200–400 W |
| NVIDIA H100 80GB HBM3 | 120 | 700 | 1.50 | 350–700 W |
| NVIDIA L40S | 60 | 350 | 1.40 | 200–350 W |
| AMD Instinct MI300X | 100 | 750 | 0.85 | 350–750 W |
| AMD Radeon PRO W7900 | 40 | 295 | 1.20 | 200–295 W |
computeGamma controls cap sensitivity: higher gamma = more throughput retained under capping.
At 80% GPU cap: H100 NVL loses ~13.5%, MI300X loses ~22.7% throughput.
Full power-model details: Power Simulator
Run configuration
- Seeds:
3 - Mean inter-arrival:
0.12 s - Time scale:
60× - Timeout:
14400 s - Perf ratio:
15%, eco ratio:0%, GPU ratio:45% - Workload types:
debug_eval,single_gpu_training,cpu_preprocess,cpu_analytics- Note:
distributed_trainingandparameter_server_trainingwere present in the archived run but removed from future benchmarks (require a gang scheduler to avoid deadlock)
- Note:
- Policy caps: CPU eco at
80%, GPU eco at80%of peak
Algorithms used
Controller policies
static_partition:hpCount = round(N * 0.45)→ ~18 performance nodes, ~23 eco nodes
queue_aware_v1:baseCount = round(N * 0.50), dynamic adjustment from live perf-pod counthpCount = clamp(max(baseCount, queueNeed), 2, 10, N)
- Downgrade guard:
performance → ecodeferred while performance-sensitive pods run on node
Results summary
Per-seed results
| Baseline | Seed | Wall (s) | Throughput (jobs/sim-hr) | Energy (kWh sim) | Avg power (W) | Status |
|---|---|---|---|---|---|---|
| A | 1 | 14522 | 11.24 | - | - | INCOMPLETE (gang deadlock) |
| A | 2 | 1847.4 | 90.39 | 1639.85 | 53260 | completed |
| A | 3 | 2149.7 | 76.81 | 2132.43 | 59518 | completed |
| B | 1 | 14521 | 11.24 | - | - | INCOMPLETE (gang deadlock) |
| B | 2 | 1978.6 | 84.39 | 1758.23 | 53316 | completed |
| B | 3 | 2148.3 | 76.86 | 2081.34 | 58129 | completed |
| C | 1 | 2040.9 | 80.00 | 1874.63 | 55113 | completed |
| C | 2 | 1980.5 | 84.31 | 1754.29 | 53147 | completed |
| C | 3 | 2031.5 | 81.28 | 1967.31 | 58105 | completed |
Baseline means (seeds 2+3 fair comparison)
| Baseline | Mean wall (s) | Mean throughput (jobs/sim-hr) | Mean energy (kWh sim) | Mean cluster power (W) |
|---|---|---|---|---|
| A | 1998.5 | 83.60 | 1886.1 | 56389 |
| B | 2063.5 | 80.63 | 1919.8 | 55723 |
| C | 2017.6 | 81.86 | 1865.4 | 55455 |
Relative to A (seeds 2+3):
- B: energy +1.8%, throughput −3.6%
- C: energy −1.3%, throughput −1.0%
Plot commentary
Runtime distribution
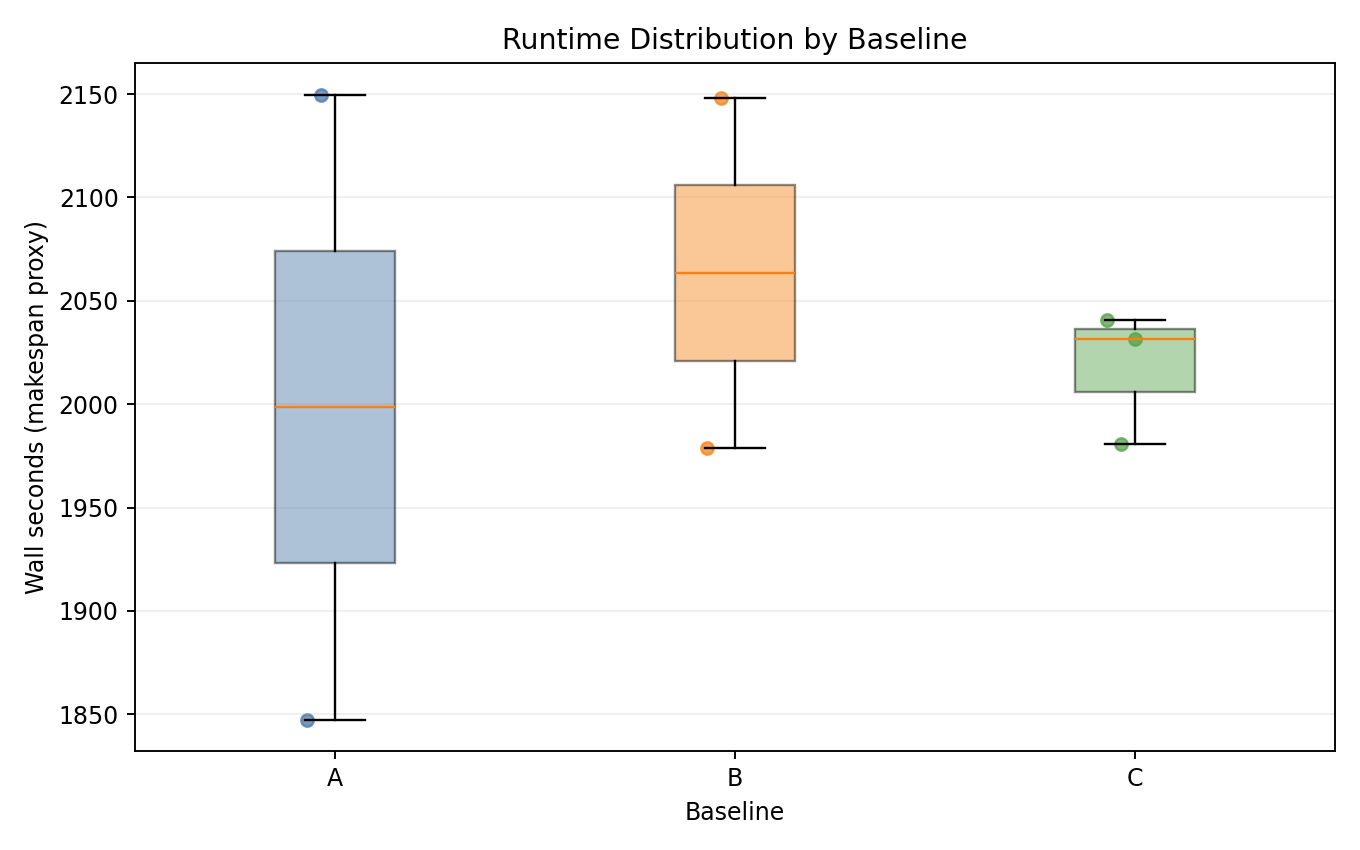
- Seeds 2 and 3 show near-overlapping distributions; seed 1 deadlocks excluded.
Energy vs makespan
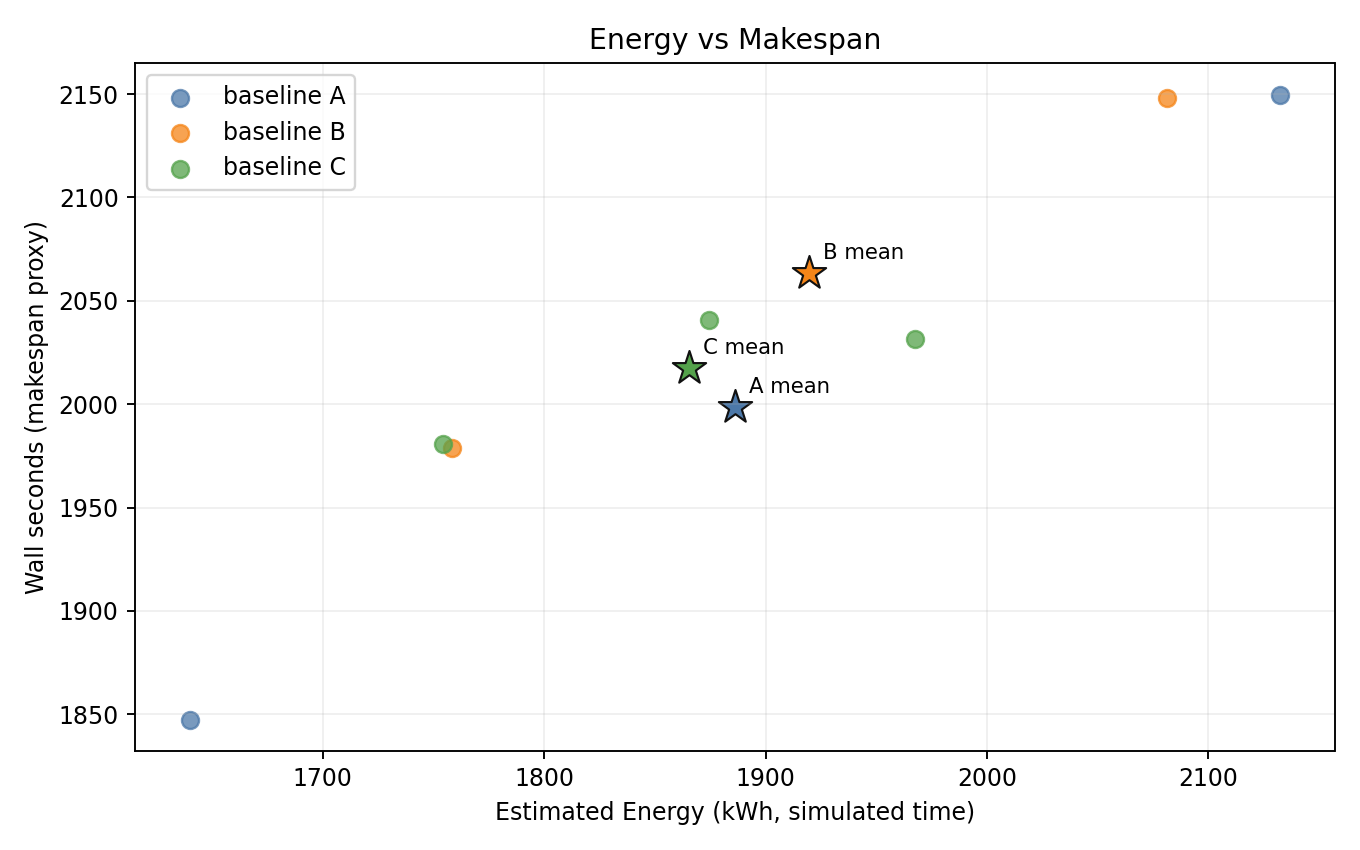
- Small energy differences relative to large absolute values (~1900 kWh sim) dominated by GPU idle power.
- C has lower variance (all 3 seeds completed).
Baseline means
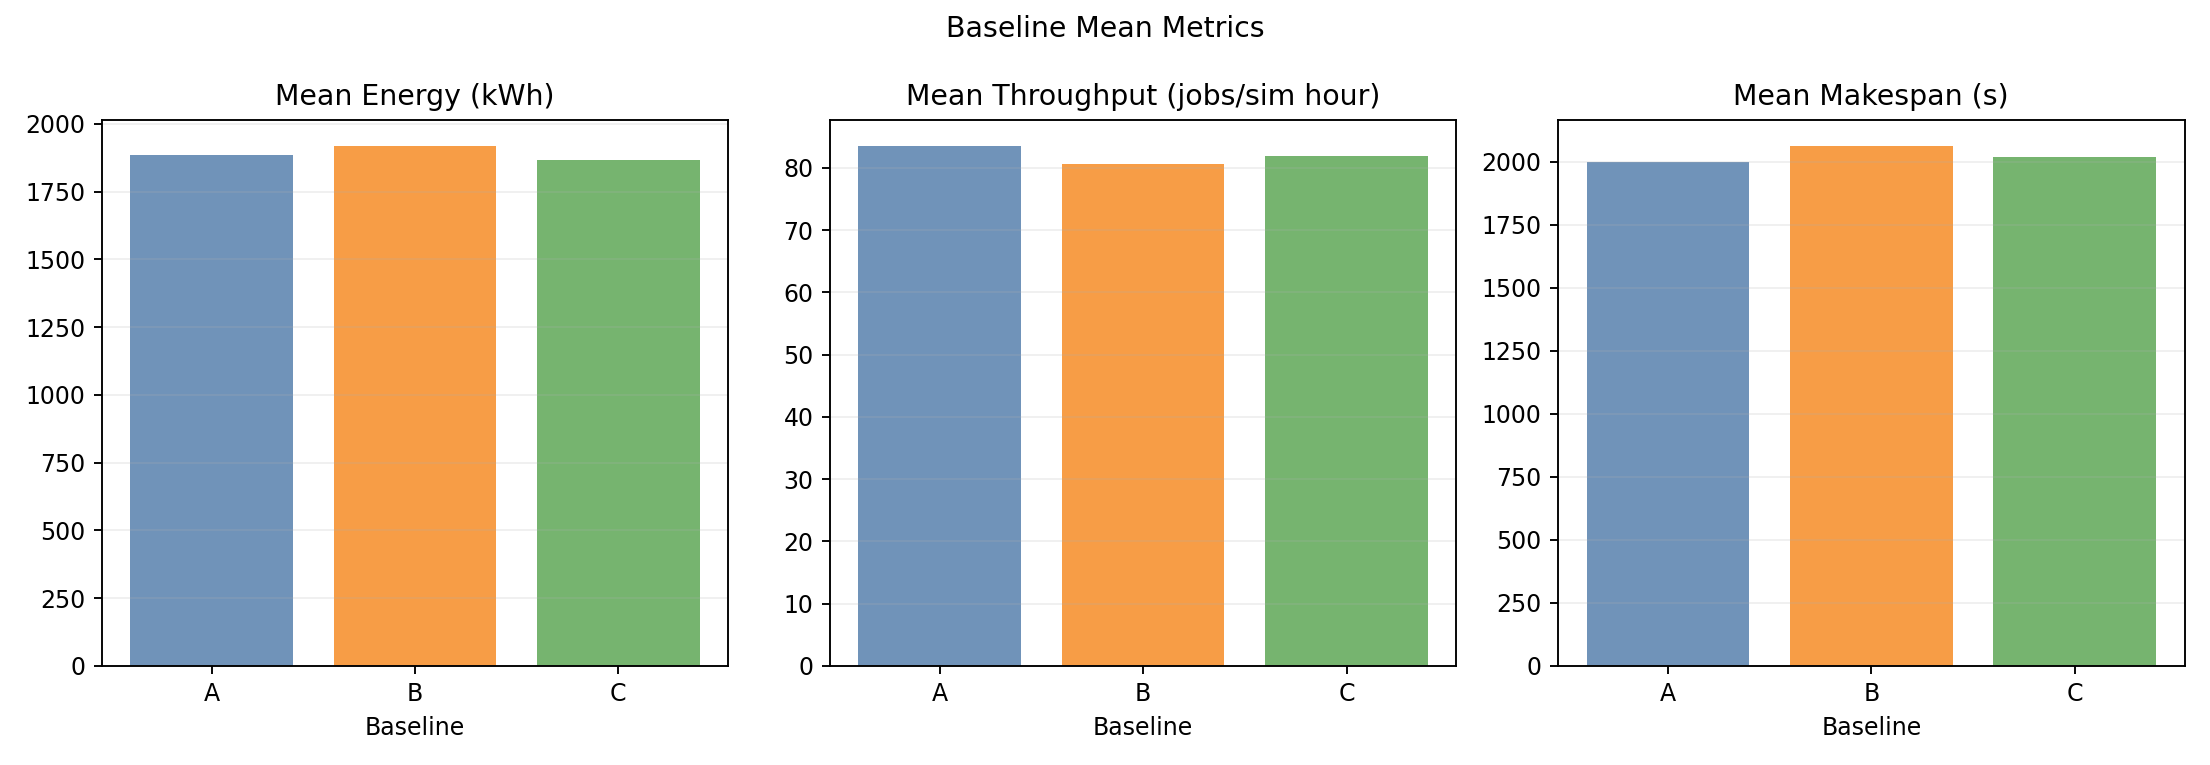
- Throughput and wall-time bars show modest inter-baseline differences.
- Energy bars are nearly flat: B slightly above A, C marginally below.
Relative tradeoff vs A
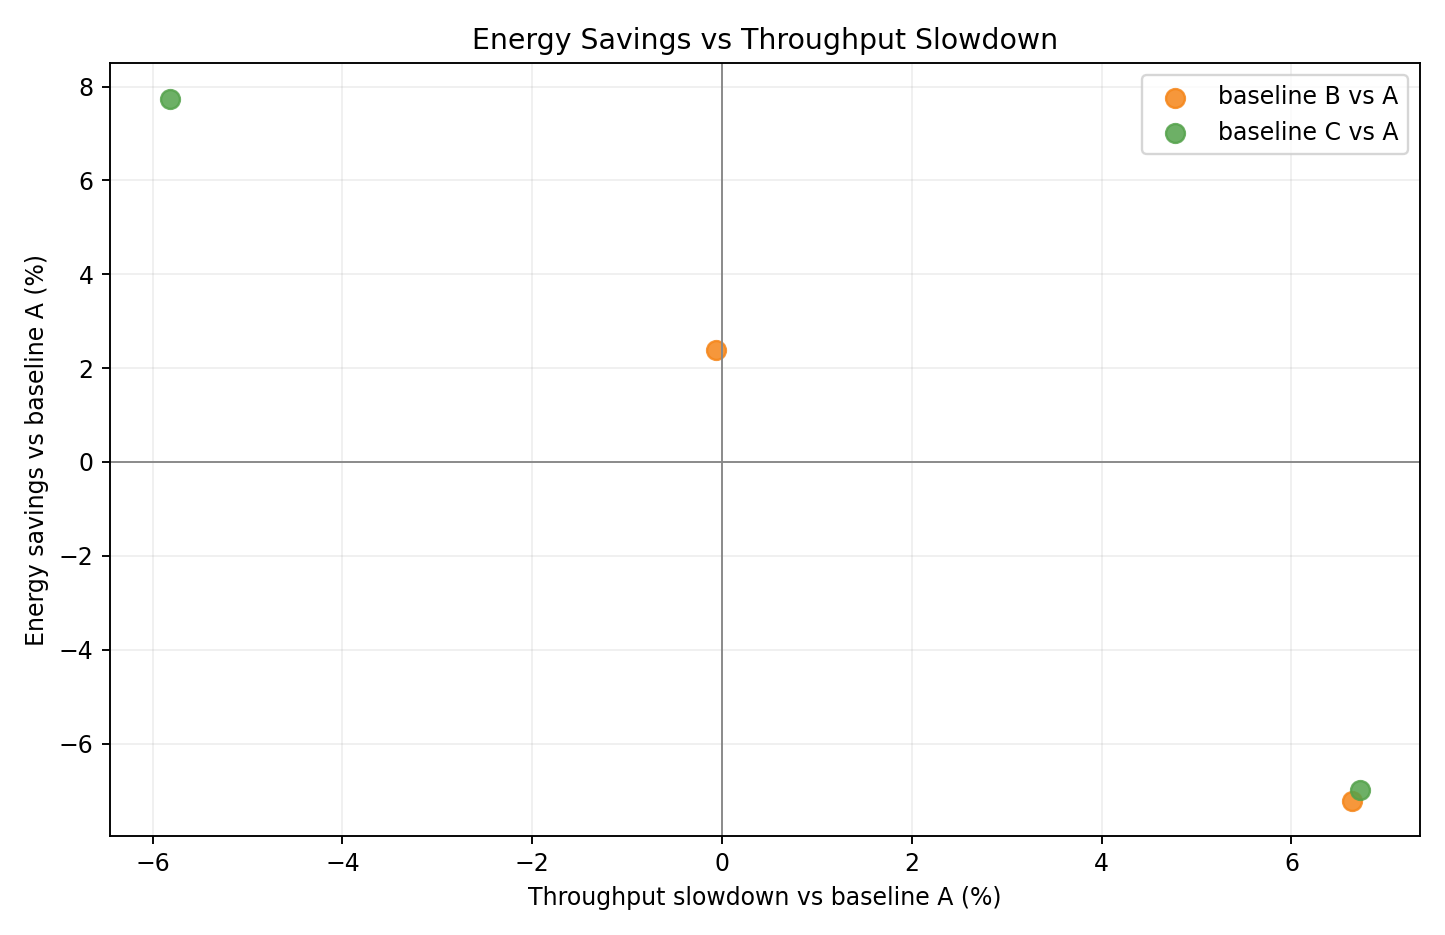
- Per-seed scatter of energy delta vs throughput delta relative to A.
- C seeds cluster near the origin; B seeds show energy increase with throughput loss.
Relative tradeoff bars vs A
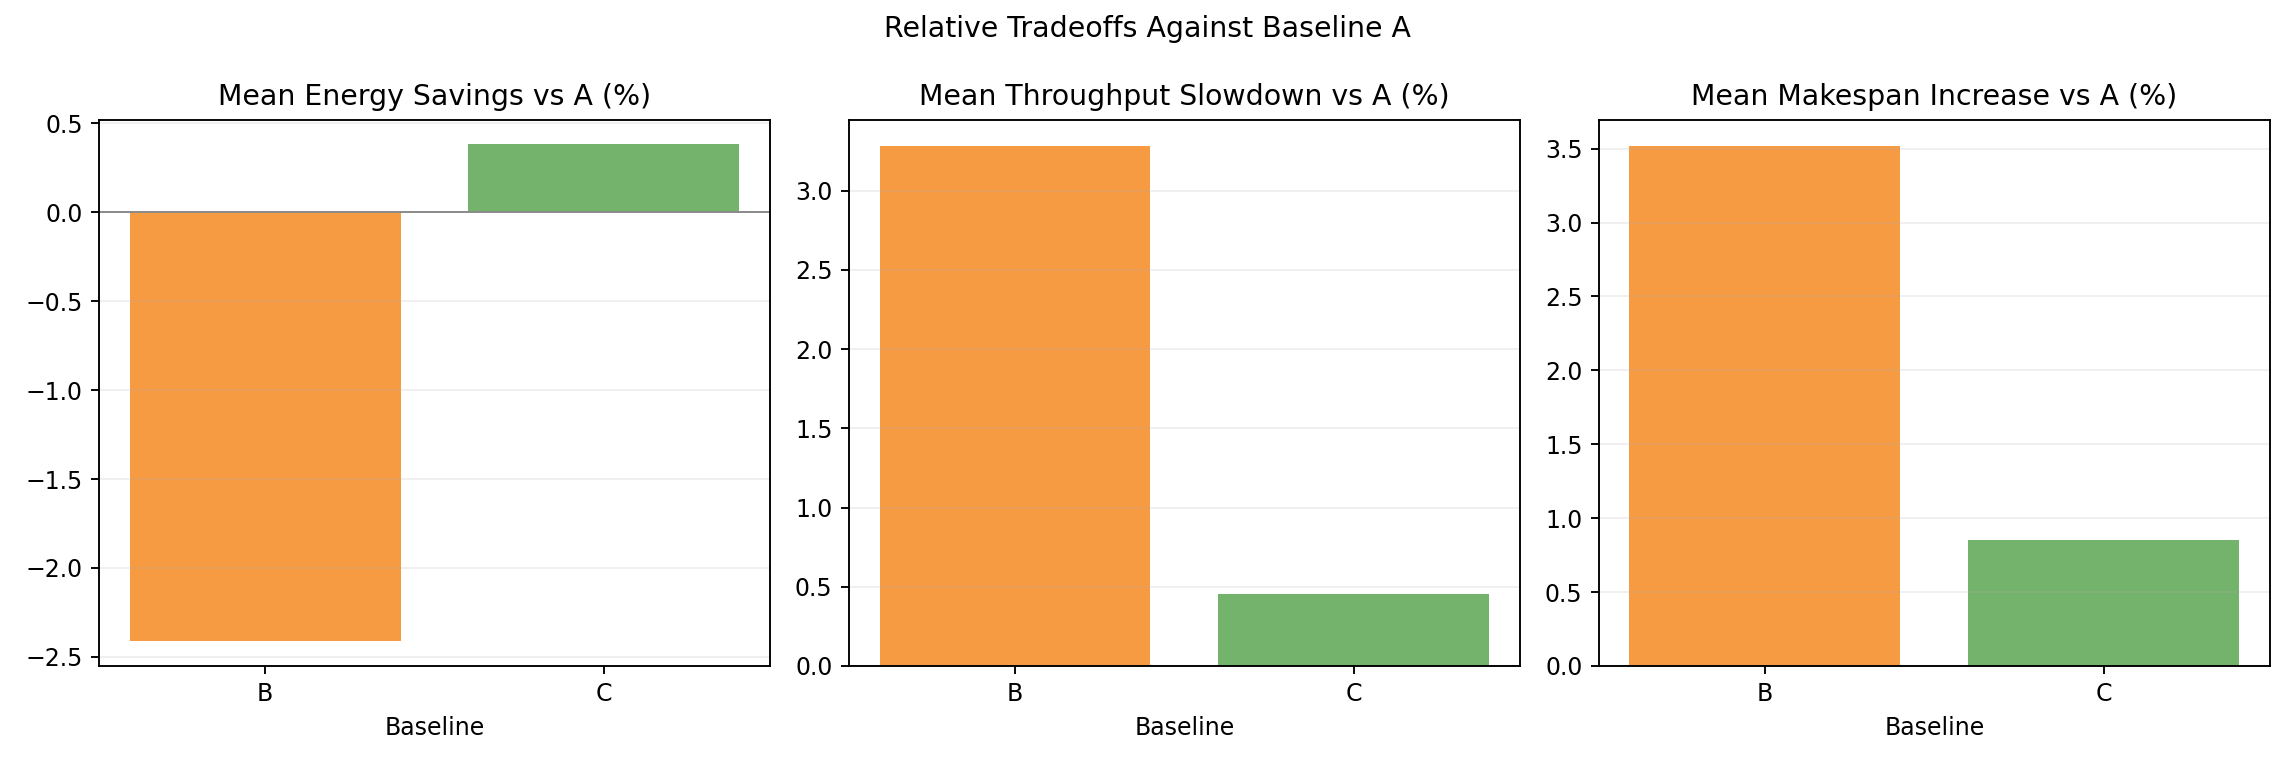
- Mean energy and throughput deltas: B at +1.8% energy / -3.6% throughput, C at -1.3% / -1.0%.
Hardware family tradeoff vs A
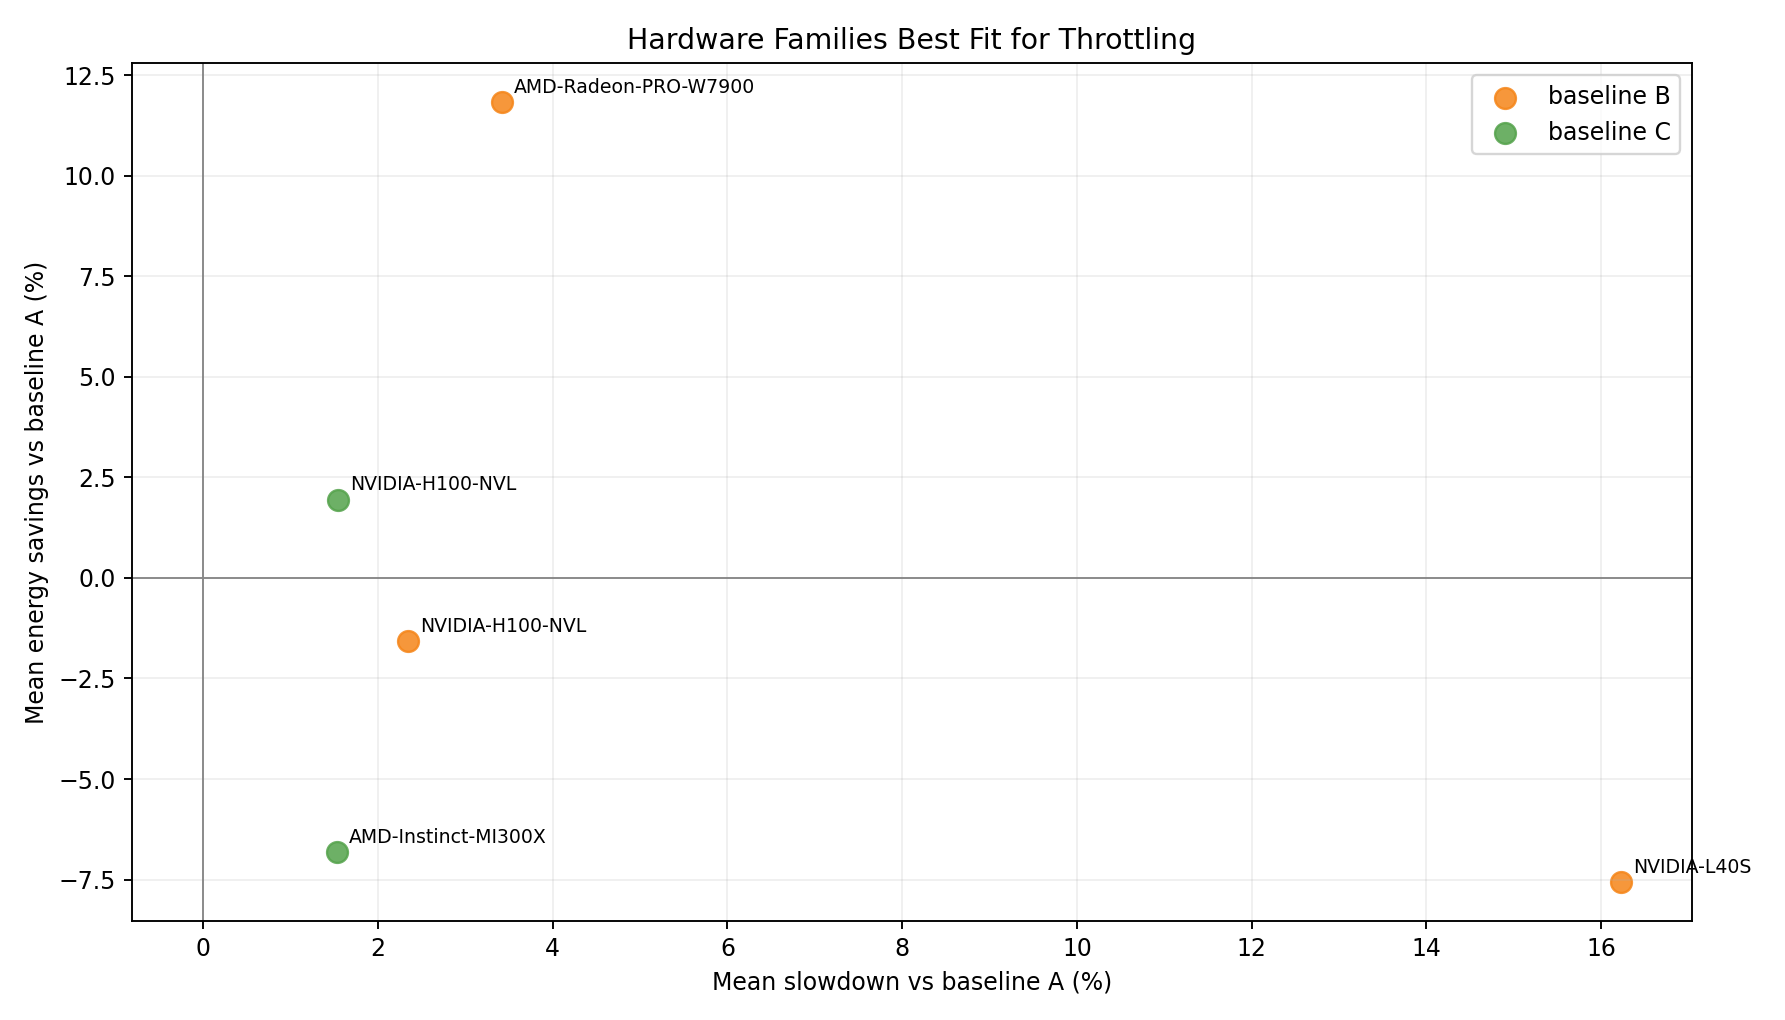
- H100 NVL (dominant energy contributor) does not see expected energy reduction - CPU throttling on GPU nodes extends job duration.
- MI300X more sensitive to capping (lower computeGamma).
Hardware family rankings - baseline B
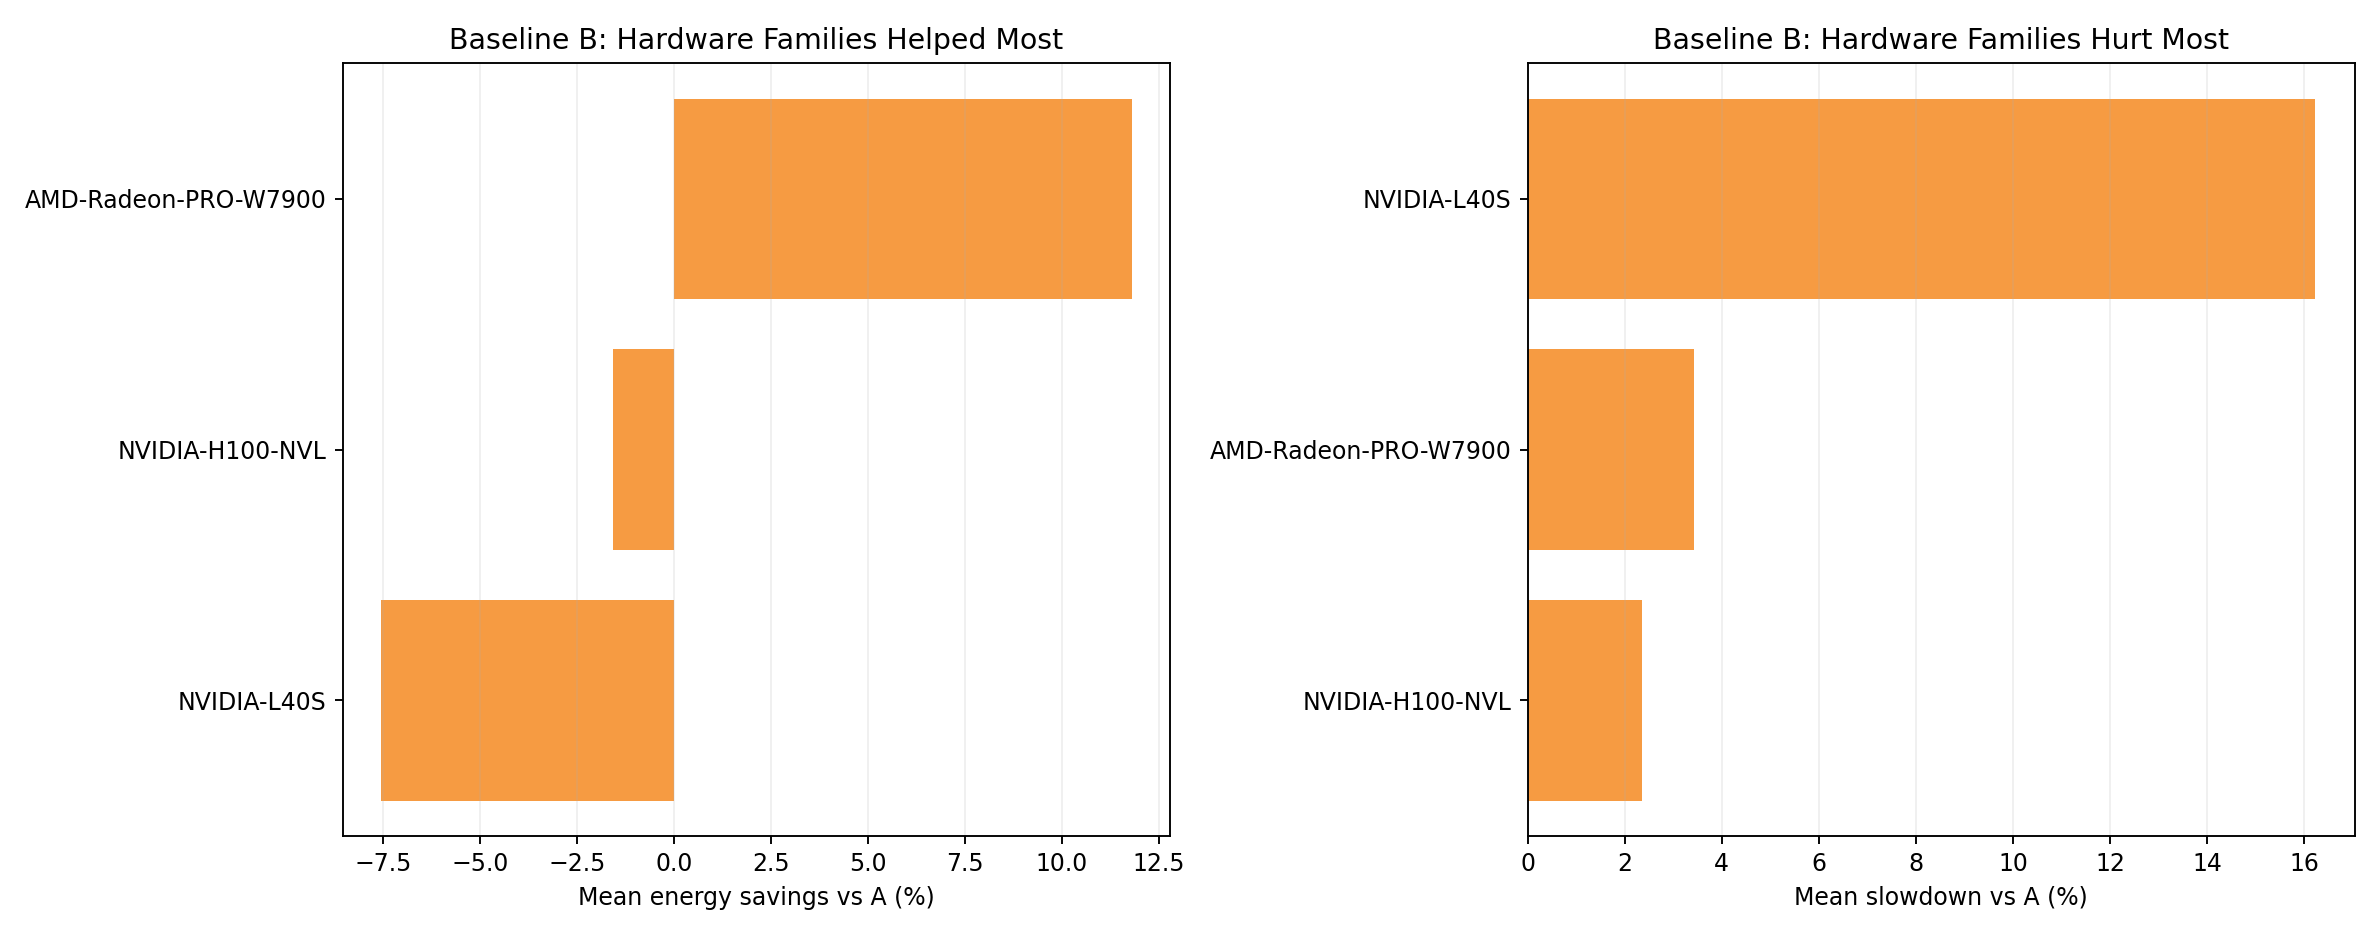
- Per-family energy and throughput under B policy relative to A.
- MI300X shows the largest percentage throughput loss due to its lower computeGamma.
Hardware family rankings - baseline C
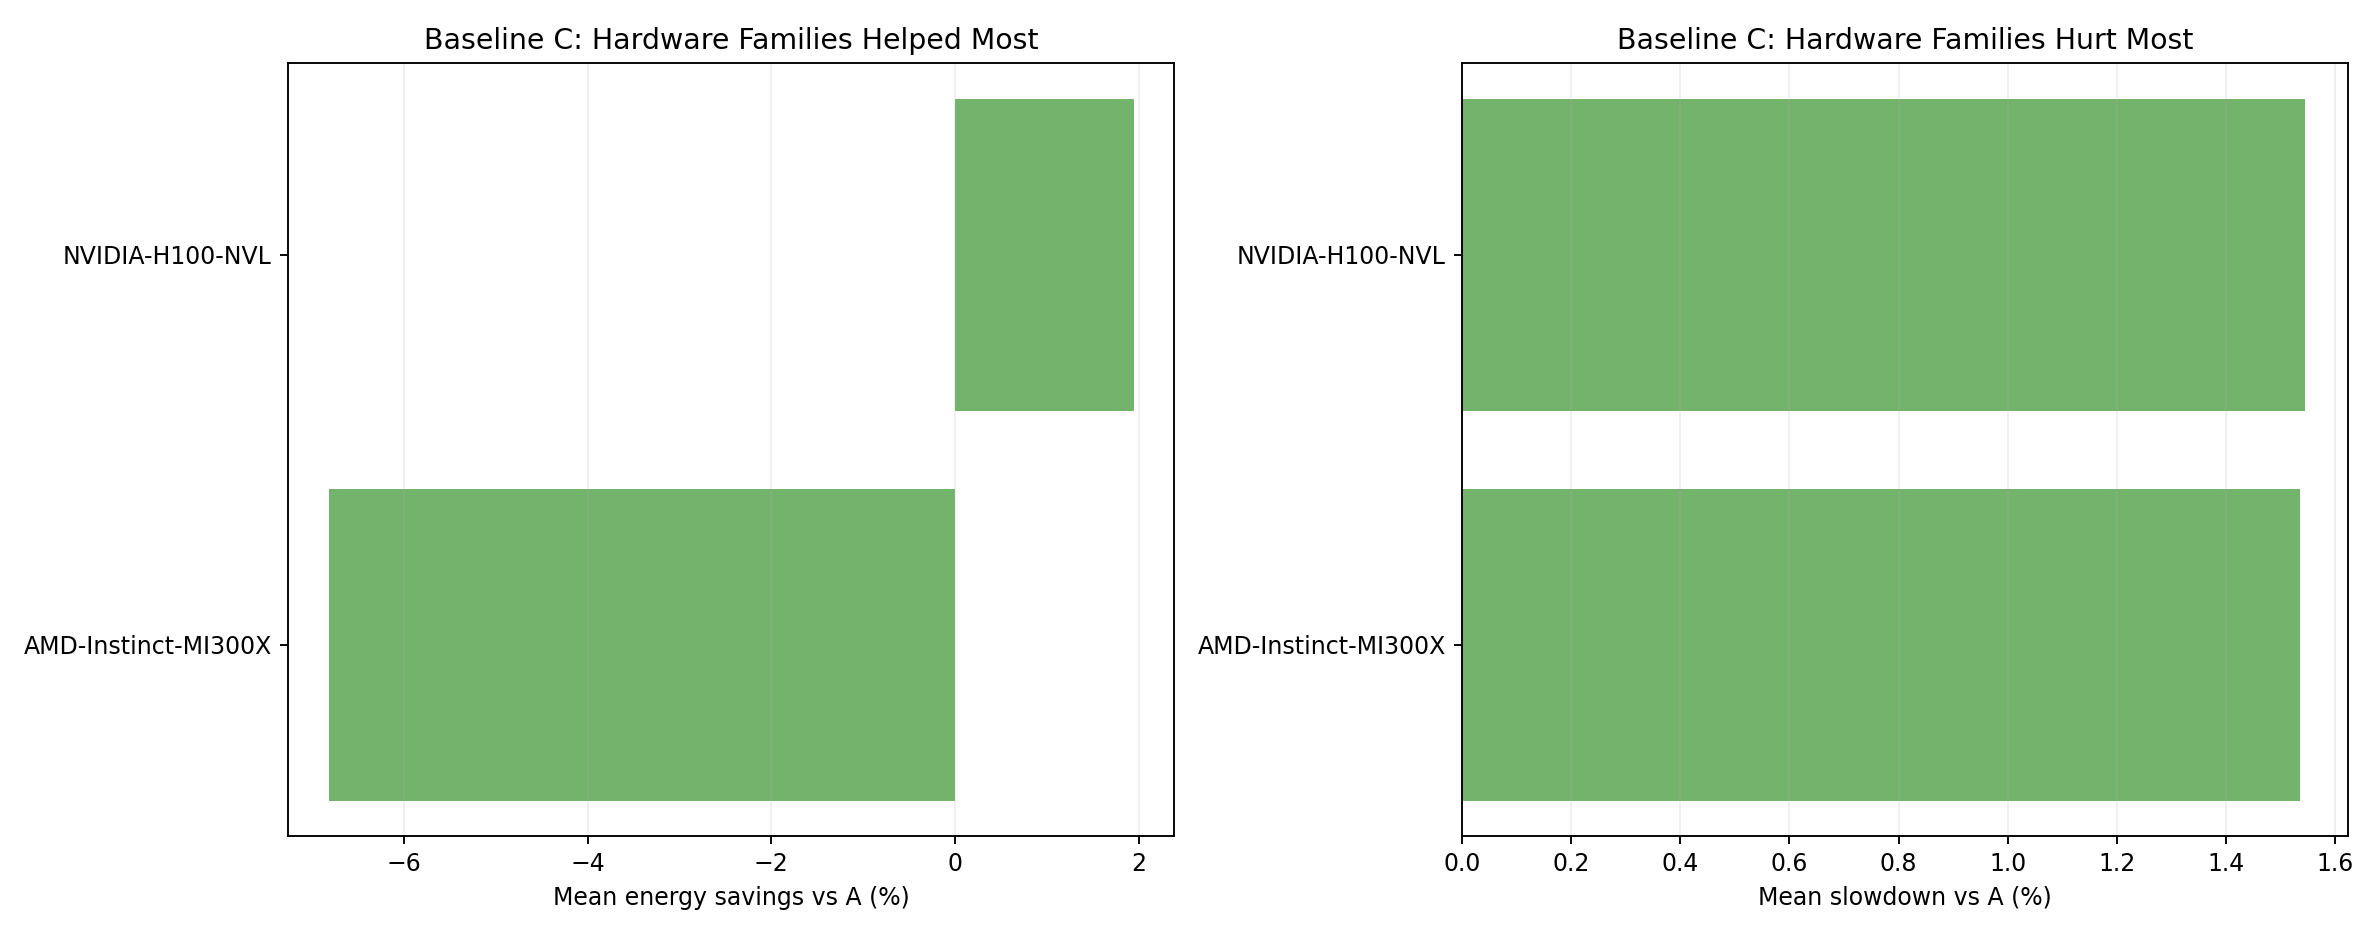
- C shows better outcomes than B across most families, especially H100 NVL.
Workload type tradeoff vs A
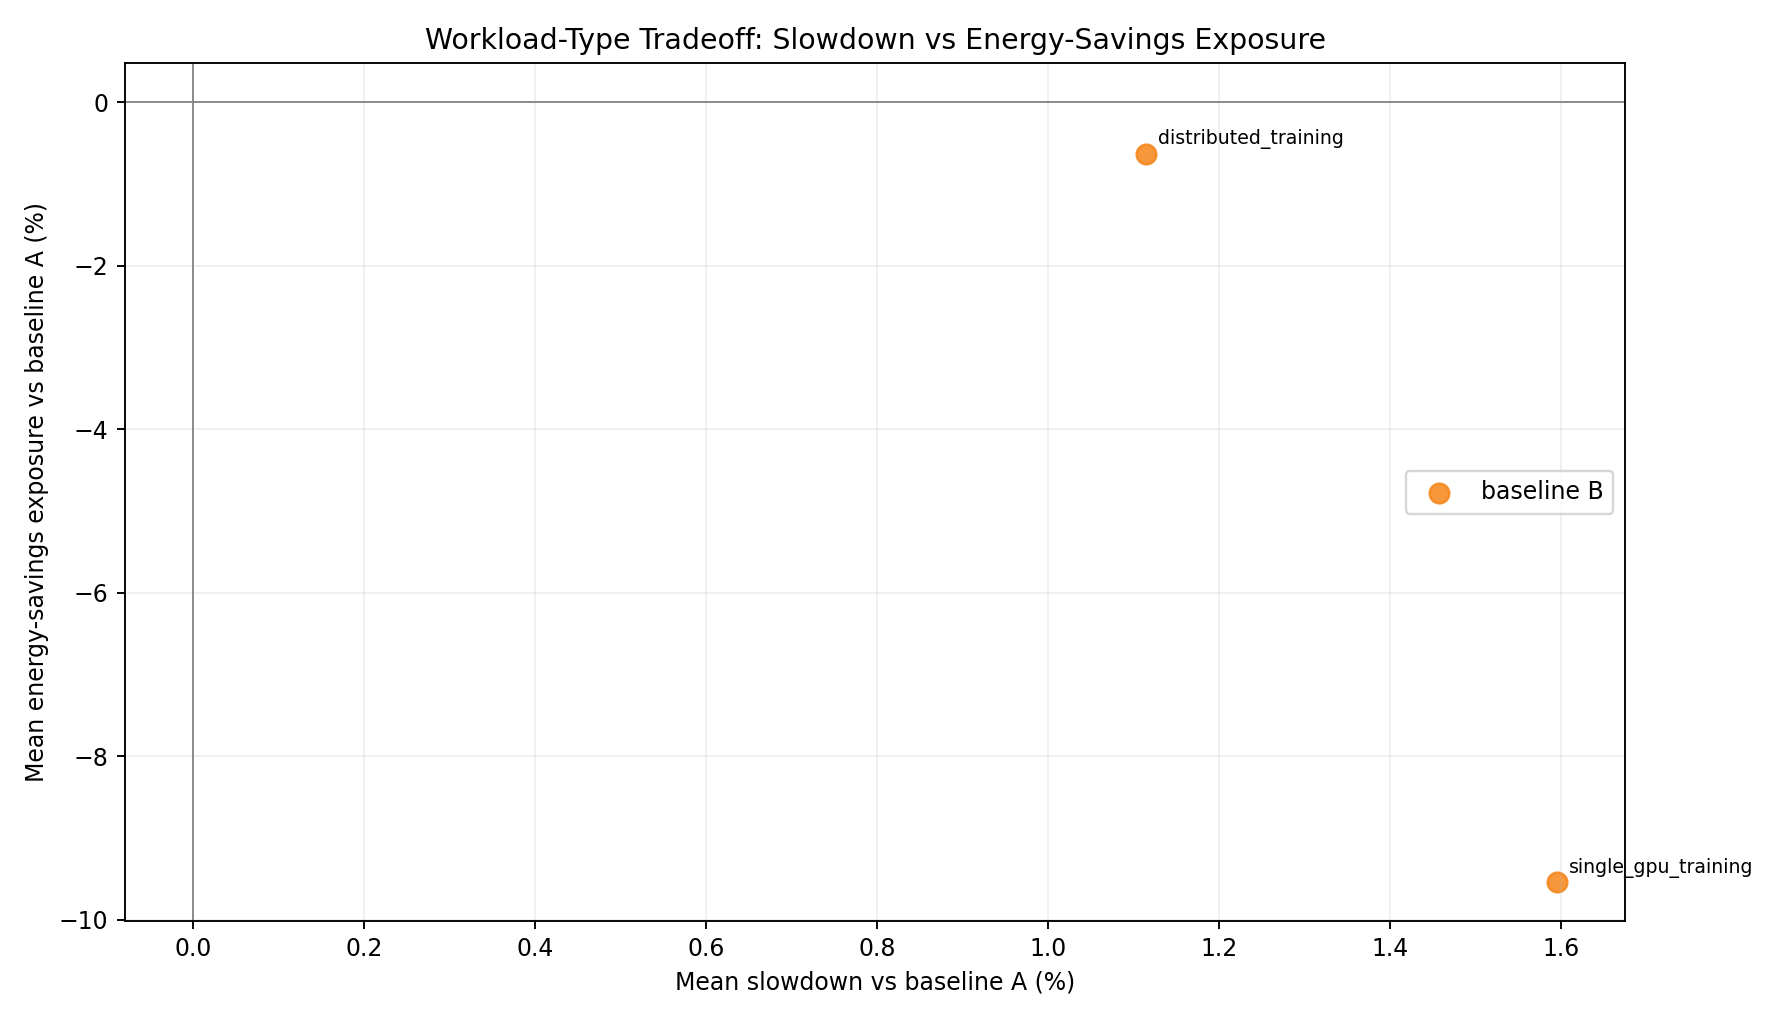
- GPU-heavy jobs are most affected; CPU-only jobs on CPU-only nodes show negligible impact.
Workload type rankings - baseline B
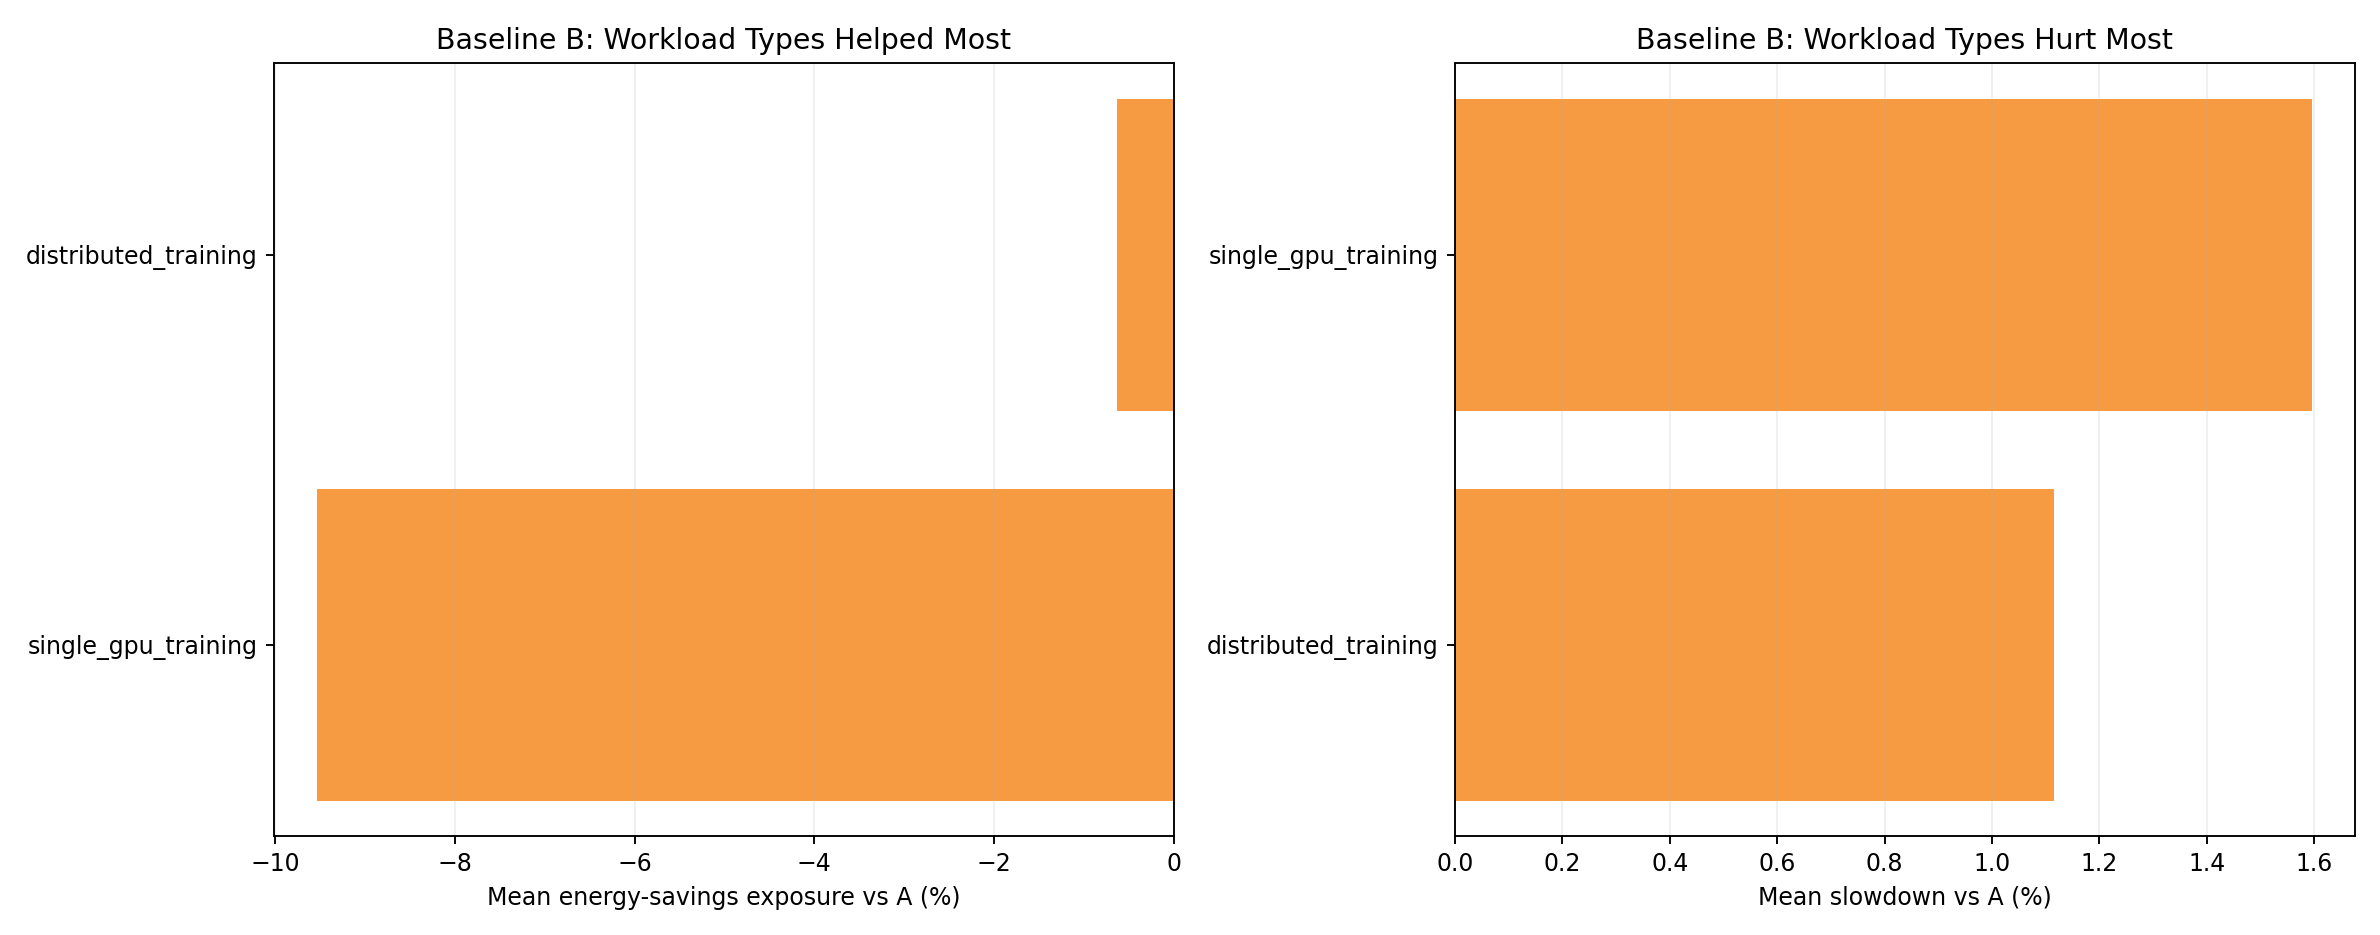
single_gpu_trainingshows the highest slowdown: CPU throttling on GPU nodes limits data-feed throughput.
Completion summary
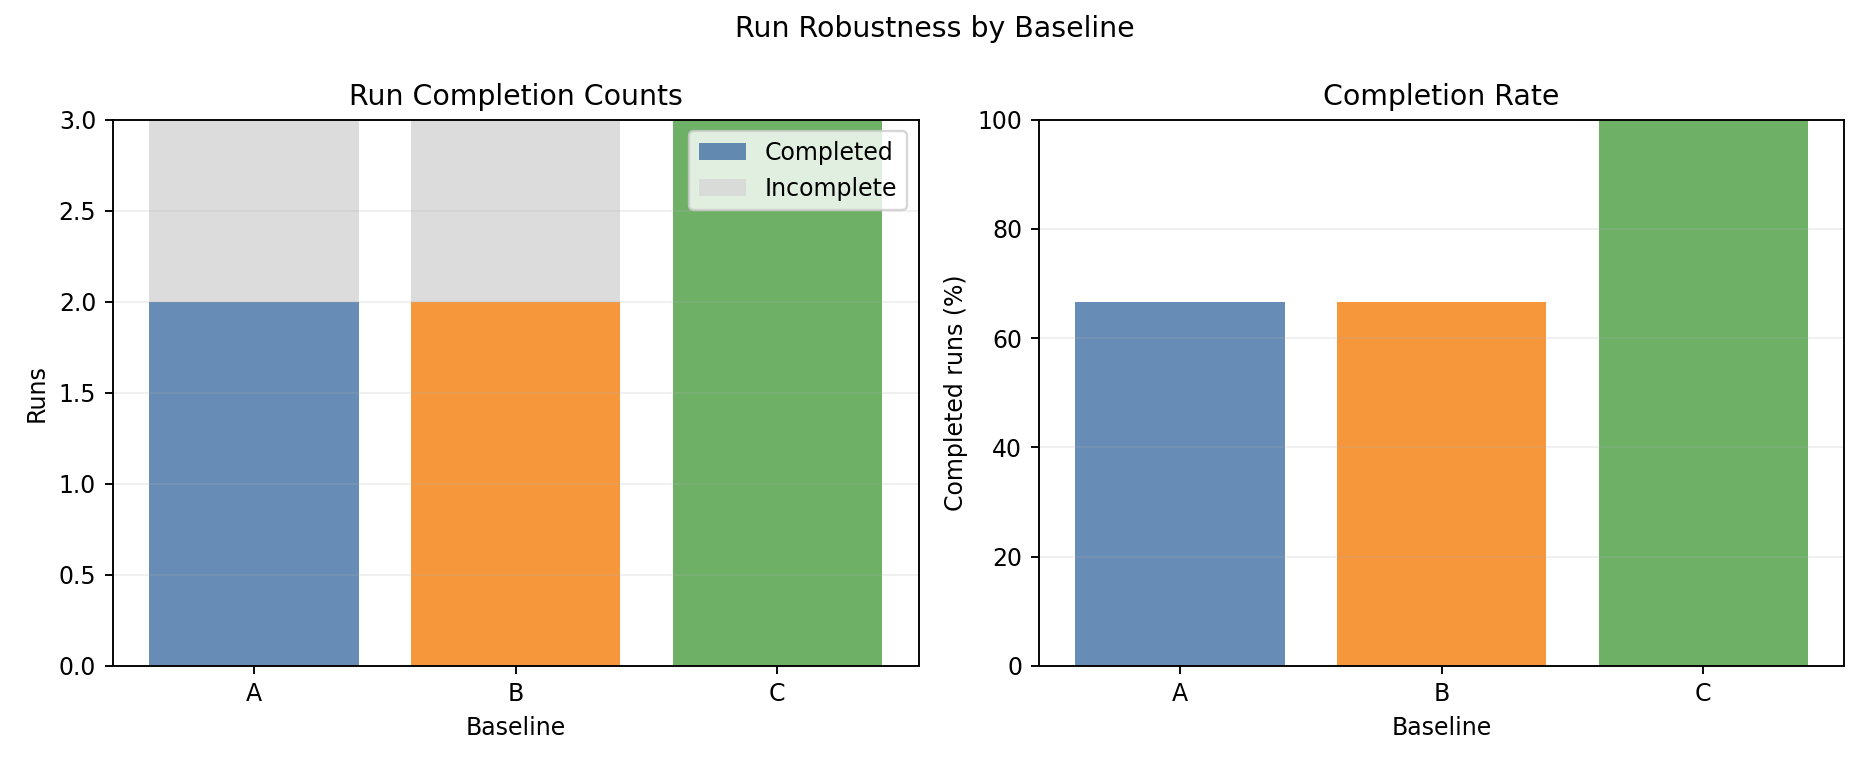
- C achieves 100% completion; A and B each have 1 failed seed from gang deadlock.
Gang scheduling deadlock (seed 1)
Baselines A and B both timed out in seed 1 with 1000+ pods permanently stuck. Root cause: multi-pod jobs without a gang scheduler create circular partial allocation - each job holds some nodes partially occupied, waiting for pods that cannot land. Baseline C avoided deadlock via incidental pod evictions from operator reconcile cycles.
Multi-pod job types have been removed from all future benchmarks.
Interpretation
Why does Joulie not save energy on GPU clusters?
GPU idle power dominates (~75–85% of total): H100 NVL alone consumes 80 W/GPU × 96 GPUs = 7680 W idle floor. Any job duration extension accumulates proportionally more idle energy.
CPU cap slows GPU jobs: Joulie’s eco profile applies CPU frequency throttling to GPU nodes. The throttled CPU cannot feed the GPU fast enough (
cpuFeedFactormechanism), reducing GPU effective speed and extending job duration. This outweighs CPU power savings.Wrong control axis: The energy-efficient lever on GPU nodes is GPU power cap, not CPU frequency reduction.
Queue-aware (C) partially mitigates this by reducing eco-node count during GPU-heavy phases, keeping more nodes uncapped.
Best-fit use case
queue_aware_v1achieves a marginal −1.3% energy saving on heterogeneous GPU clusters.static_partitionincreases energy by +1.8% due to indiscriminate CPU throttling on GPU nodes.- Future work: workload-type-aware policy - apply CPU caps only on CPU-only nodes, GPU caps selectively on GPU nodes.