KWOK Benchmark Experiment
This page reports the current benchmark results from the first experiment in:
Scope
The benchmark compares three baselines:
A: simulator only (Joulie-free)B: Joulie with static partition policyC: Joulie with queue-aware policy
It evaluates throughput/makespan vs energy under real Kubernetes scheduling with KWOK nodes and simulated power control.
Experimental setup
Cluster and nodes
- kind control-plane + worker (real control plane)
- 5 managed KWOK nodes (
kwok-node-0..4) - workload pods target KWOK nodes via selector + toleration
Hardware models in simulator
Mapped by node labels to two classes:
intel-kwok:BaseIdleW=65,PMaxW=420,AlphaUtil=1.1,BetaFreq=1.25,FMin/FMax=1200/3200amd-kwok:BaseIdleW=75,PMaxW=460,AlphaUtil=1.2,BetaFreq=1.35,FMin/FMax=1200/3400
Variable meaning:
BaseIdleW: modeled CPU package idle power floor (Watts)PMaxW: modeled package power at full dynamic load before capping (Watts)AlphaUtil: exponent controlling how strongly power grows with utilizationBetaFreq: exponent controlling how strongly power grows with frequency scaleFMin/FMax: min/max CPU frequency bounds used to derive feasible frequency scale
Full power-model details are documented in:
Run configuration
- seeds:
3 - jobs per seed:
300 - mean inter-arrival:
0.20s - timeout:
1800s - time-scale:
60 - workload mix:
20%performance-affinity30%eco-affinity50%no affinity (general)
Per-seed canonical workload class counts:
- seed 1: performance
63, eco94, general143 - seed 2: performance
72, eco72, general156 - seed 3: performance
55, eco93, general152
Algorithms used
Controller policies
static_partition:hpCount = round(N * STATIC_HP_FRAC)- first
hpCountnodes => performance, others => eco
queue_aware_v1:baseCount = round(N * QUEUE_HP_BASE_FRAC)queueNeed = ceil(perfIntentPods / QUEUE_PERF_PER_HP_NODE)hpCount = clamp(max(baseCount, queueNeed), hpMin, hpMax, N)
- downgrade guard:
performance -> ecodeferred if performance-sensitive pods still run on node- node remains
performanceuntil safe (deferred transition tracked in operator state/metrics)
Simulator energy and slowdown model
Per-node power:
P = BaseIdleW + (PMaxW - BaseIdleW) * util^AlphaUtil * freqScale^BetaFreq
Then cap/DVFS constraints are applied (RAPL cap range, frequency ramp, min feasible frequency, saturation flag).
Energy integration:
- at each tick:
E += P * dt - report uses simulator-integrated energy (
/debug/energy) scaled by benchmarktime_scale
Job progress and slowdown:
speed = reqCPUCores * baseSpeedPerCore * (1 - (1-freqScale)*sensitivityCPU)cpuUnitsRemaining -= speed * dt / max(1, concurrentJobsOnNode)- throttling lowers
freqScale, reducing effective speed and increasing completion time
Results summary
Primary metrics are in:
Baseline means from the dataset:
| Baseline | Mean wall time (s) | Mean throughput (jobs/sim-hour) | Mean energy (kWh sim) | Mean cluster power (W) |
|---|---|---|---|---|
| A | 1802.57 | 9.9858 | 65.1705 | 2169.25 |
| B | 1802.40 | 9.9867 | 60.2284 | 2004.94 |
| C | 1802.47 | 9.9863 | 62.1140 | 2067.63 |
Relative to A:
- B: energy
-7.58%, throughput/makespan effectively unchanged - C: energy
-4.69%, throughput/makespan effectively unchanged
Plot commentary
Runtime distribution
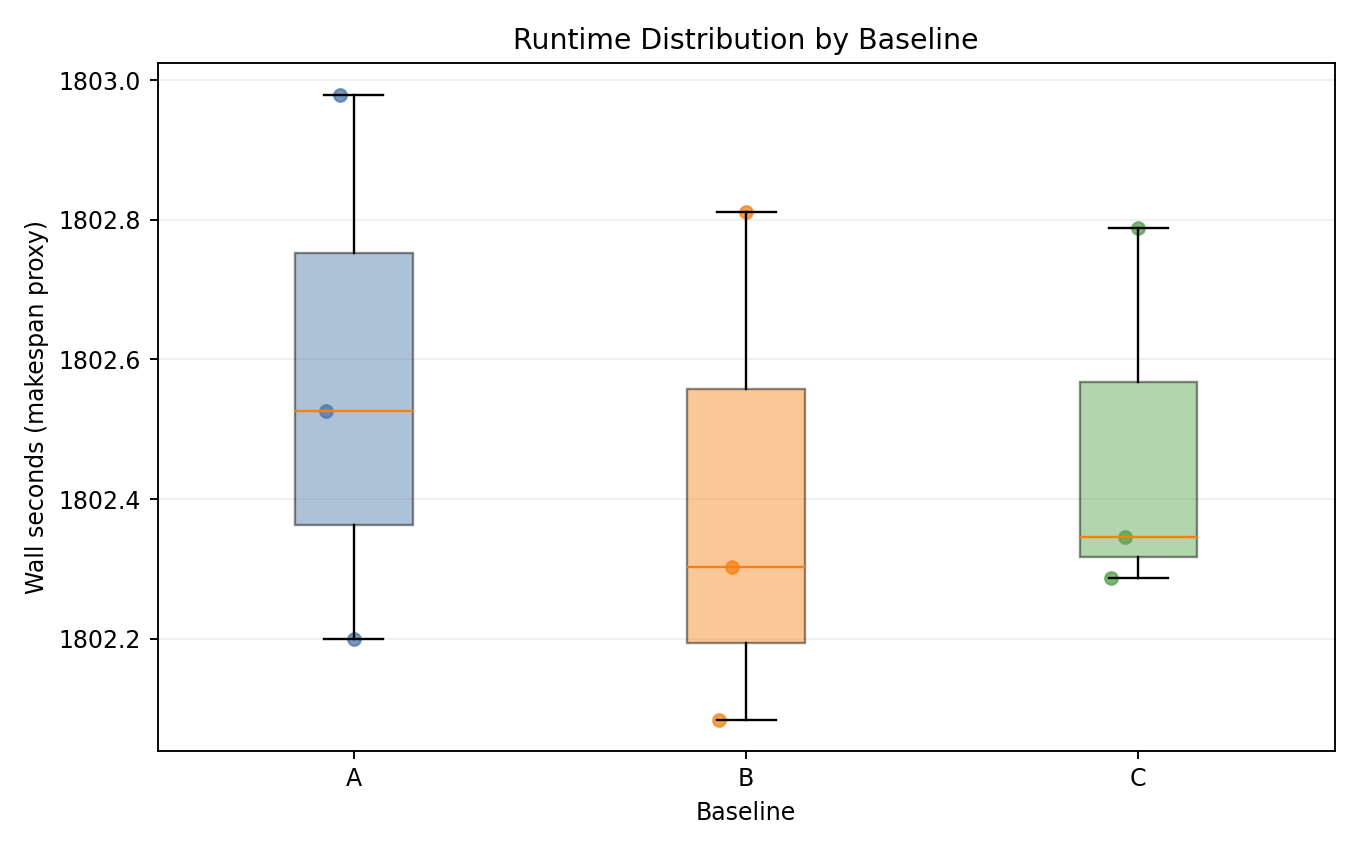
- Baselines overlap almost completely in wall-time distribution.
Energy vs makespan
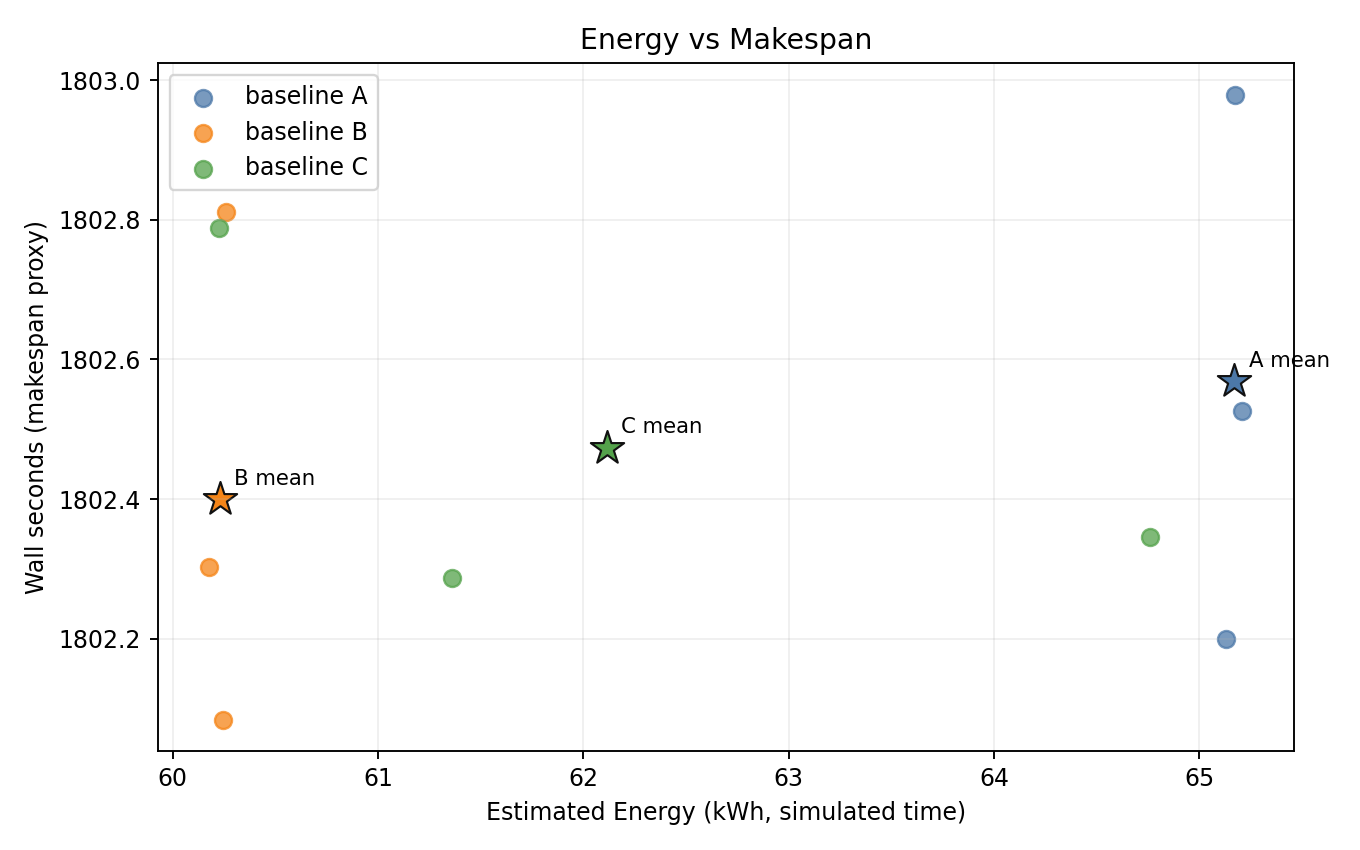
Bis consistently lower-energy thanAwith near-identical makespan.Cis more variable; one seed is close toA.
Baseline means
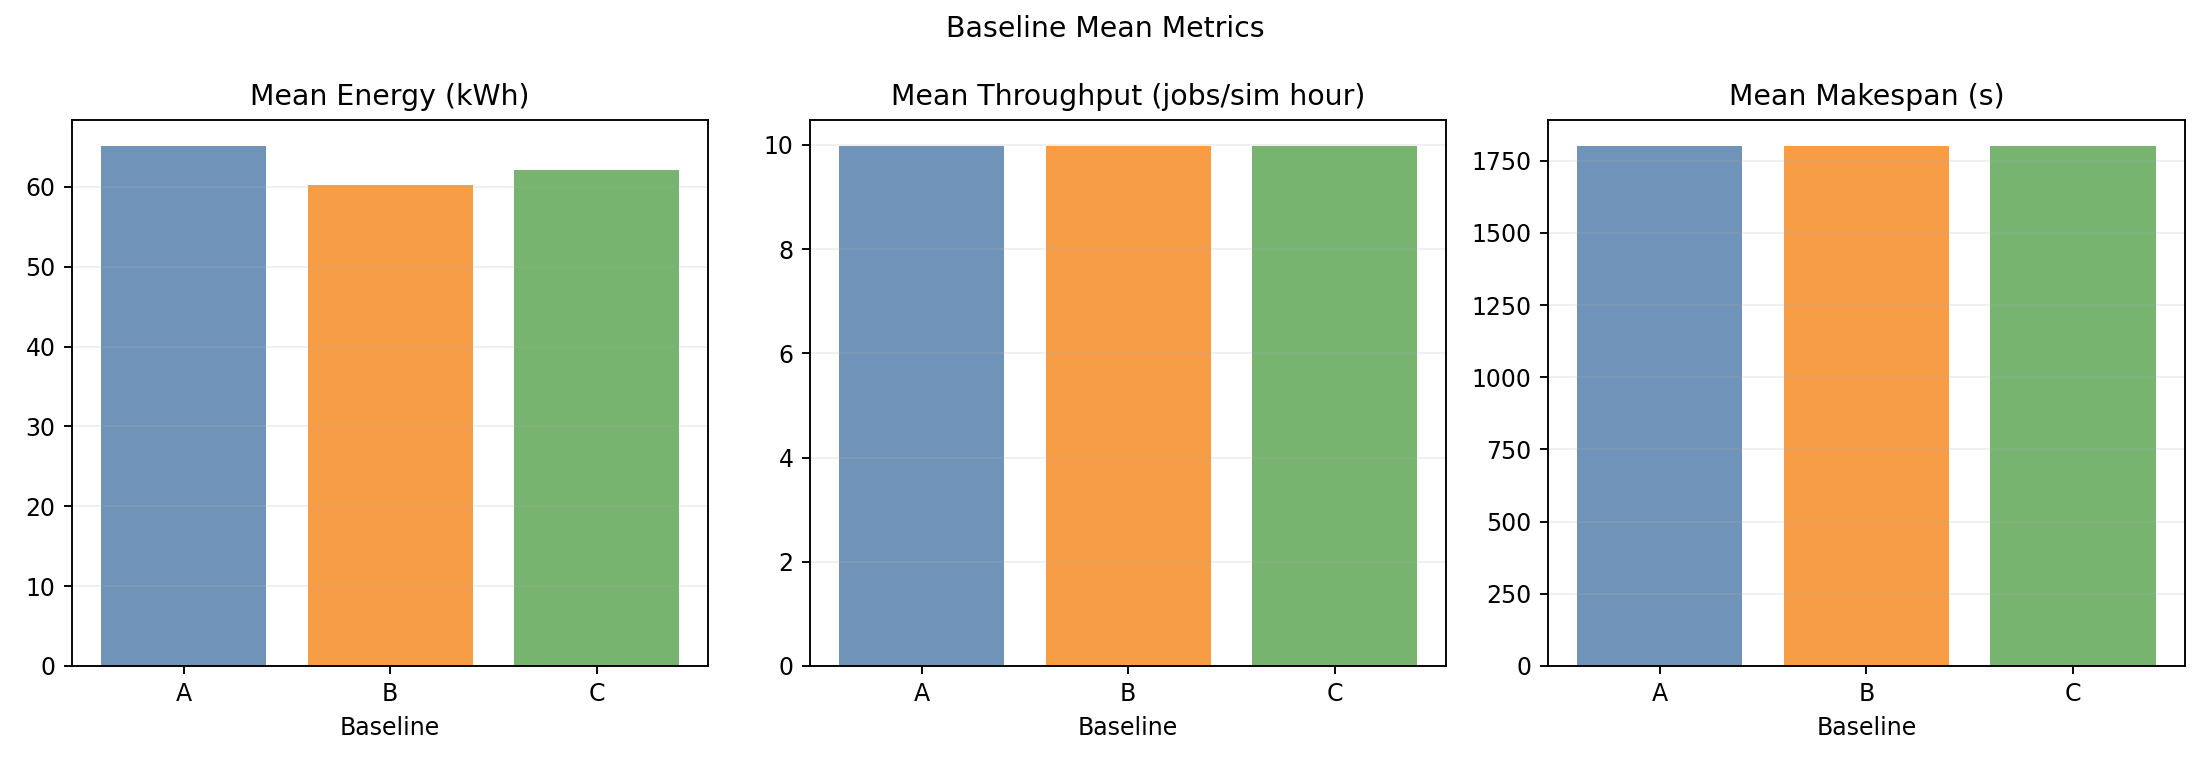
- Energy is the main differentiator; throughput/makespan are nearly flat.
Best-fit use case indicated by this data
The strongest observed benefit is:
- energy reduction with negligible throughput penalty in mixed workload clusters.
In this experiment, static_partition is the most robust policy (best and most stable energy reduction), making it a good first choice when operators need predictable savings without visible scheduling-performance impact.
Implementation details and scripts
Detailed implementation (manifests, scripts, raw outputs) is in the repository:
- Experiment folder:
- Main scripts:
- Full report markdown source: