CPU-Only Benchmark
This page reports results from the CPU-only cluster benchmark experiment (KWOK, 40 nodes):
Scope
The benchmark compares three baselines on a CPU-only cluster with 40 KWOK nodes across 3 hardware families, running on a real Kind+KWOK Kubernetes cluster:
A: Simulator only (no power management)B: Joulie with static partition policyC: Joulie with queue-aware dynamic policy
The experiment demonstrates energy savings achievable through CPU RAPL capping alone, without GPU complexity.
Experimental setup
Cluster and nodes
- Kind control-plane + worker (real Kubernetes control plane)
- 40 managed KWOK CPU-only nodes
- Workload pods target KWOK nodes via nodeSelector + toleration
- Scheduler extender provides performance/eco affinity-based filtering and scoring
Node inventory
| Node prefix | Count | CPU model | CPU cores/node | RAM/node |
|---|---|---|---|---|
| kwok-cpu-highcore | 10 | AMD EPYC 9965 192-Core | 384 (2×192) | 1,536 GiB |
| kwok-cpu-highfreq | 10 | AMD EPYC 9375F 32-Core | 64 (2×32) | 770 GiB |
| kwok-cpu-intensive | 20 | AMD EPYC 9655 96-Core | 192 (2×96) | 1,536 GiB |
Total: 40 nodes, 8,320 CPU cores, 0 GPUs.
Run configuration
| Parameter | Value |
|---|---|
| Baselines | A, B, C |
| Seeds | 1 |
| Time scale | 120× (1 wall-sec = 120 sim-sec) |
| Timeout | 660 wall-sec (~22 sim-hours) |
| Diurnal peak rate | 20 jobs/min at peak |
| Work scale | 80.0 |
| Perf ratio | 20% |
| GPU ratio | 0% |
| Workload types | cpu_preprocess, cpu_analytics |
| RAPL cap (eco) | 220 W (60% of max) |
| RAPL cap (perf) | 420 W |
| Trace generator | Python NHPP with cosine diurnal, OU noise, bursts, dips, surges |
Baselines
- A: No power management — all nodes run uncapped at full power.
- B: Static partition (
hp_frac=0.30): 12 performance nodes, 28 eco nodes. - C: Queue-aware dynamic (
hp_base_frac=0.30, min=1, max=30): dynamically adjusts performance/eco split.
PUE model (DXCooledAirsideEconomizer FMU)
PUE is computed using the DXCooledAirsideEconomizer Functional Mock-up Unit (FMU), a physics-based cooling model adapted from the Lawrence Berkeley National Lab (LBL) Buildings Library v12.1.0. The FMU is compiled from a Modelica model and executed as an FMI 2.0 co-simulation.
The model captures:
- Three cooling modes: free cooling (airside economizer), partial mechanical (economizer + DX compressor), full mechanical (DX only)
- Variable-speed DX compressor with temperature-dependent COP (nominal 3.0)
- Airside economizer with 5–100% outdoor air fraction
- Fan affinity laws: power scales with speed cubed
- Room thermal mass: 50×40×3 m data center room
Results summary
Per-baseline results
| Baseline | Avg IT Power (W) | Avg CPU Util (%) | Avg PUE | Avg Cooling (W) |
|---|---|---|---|---|
| A (no mgmt) | 3,967 | 76.8% | 1.144 | 574 |
| B (static) | 3,120 | 58.8% | 1.139 | 435 |
| C (queue-aware) | 2,814 | 51.8% | 1.140 | 393 |
Energy savings relative to baseline A
| Baseline | IT Power Reduction | Power Savings (%) |
|---|---|---|
| B (static) | −847 W | −21.4% |
| C (queue-aware) | −1,153 W | −29.1% |
Both managed baselines achieve significant power savings with zero throughput penalty — all baselines process the same workload trace.
Throughput and makespan
All baselines run the same workload trace over a fixed ~22 sim-hour window (660 wall-sec at 120× time scale). Makespan is identical by design. The throughput comparison measures concurrent scheduling efficiency:
| Baseline | Avg Concurrent Pods | Max Concurrent Pods | Δ Avg Pods vs A |
|---|---|---|---|
| A (no mgmt) | 23.4 | 44 | — |
| B (static) | 12.6 | 15 | −46.2% |
| C (queue-aware) | 9.5 | 11 | −59.4% |
Managed baselines run fewer concurrent pods because the scheduler extender concentrates work onto performance nodes. Despite fewer concurrent pods, no jobs are dropped — B and C process the same trace as A. The reduced concurrency reflects better scheduling efficiency: fewer nodes are actively loaded at any time, enabling deeper eco capping on idle nodes.
Plot commentary
Power timeseries
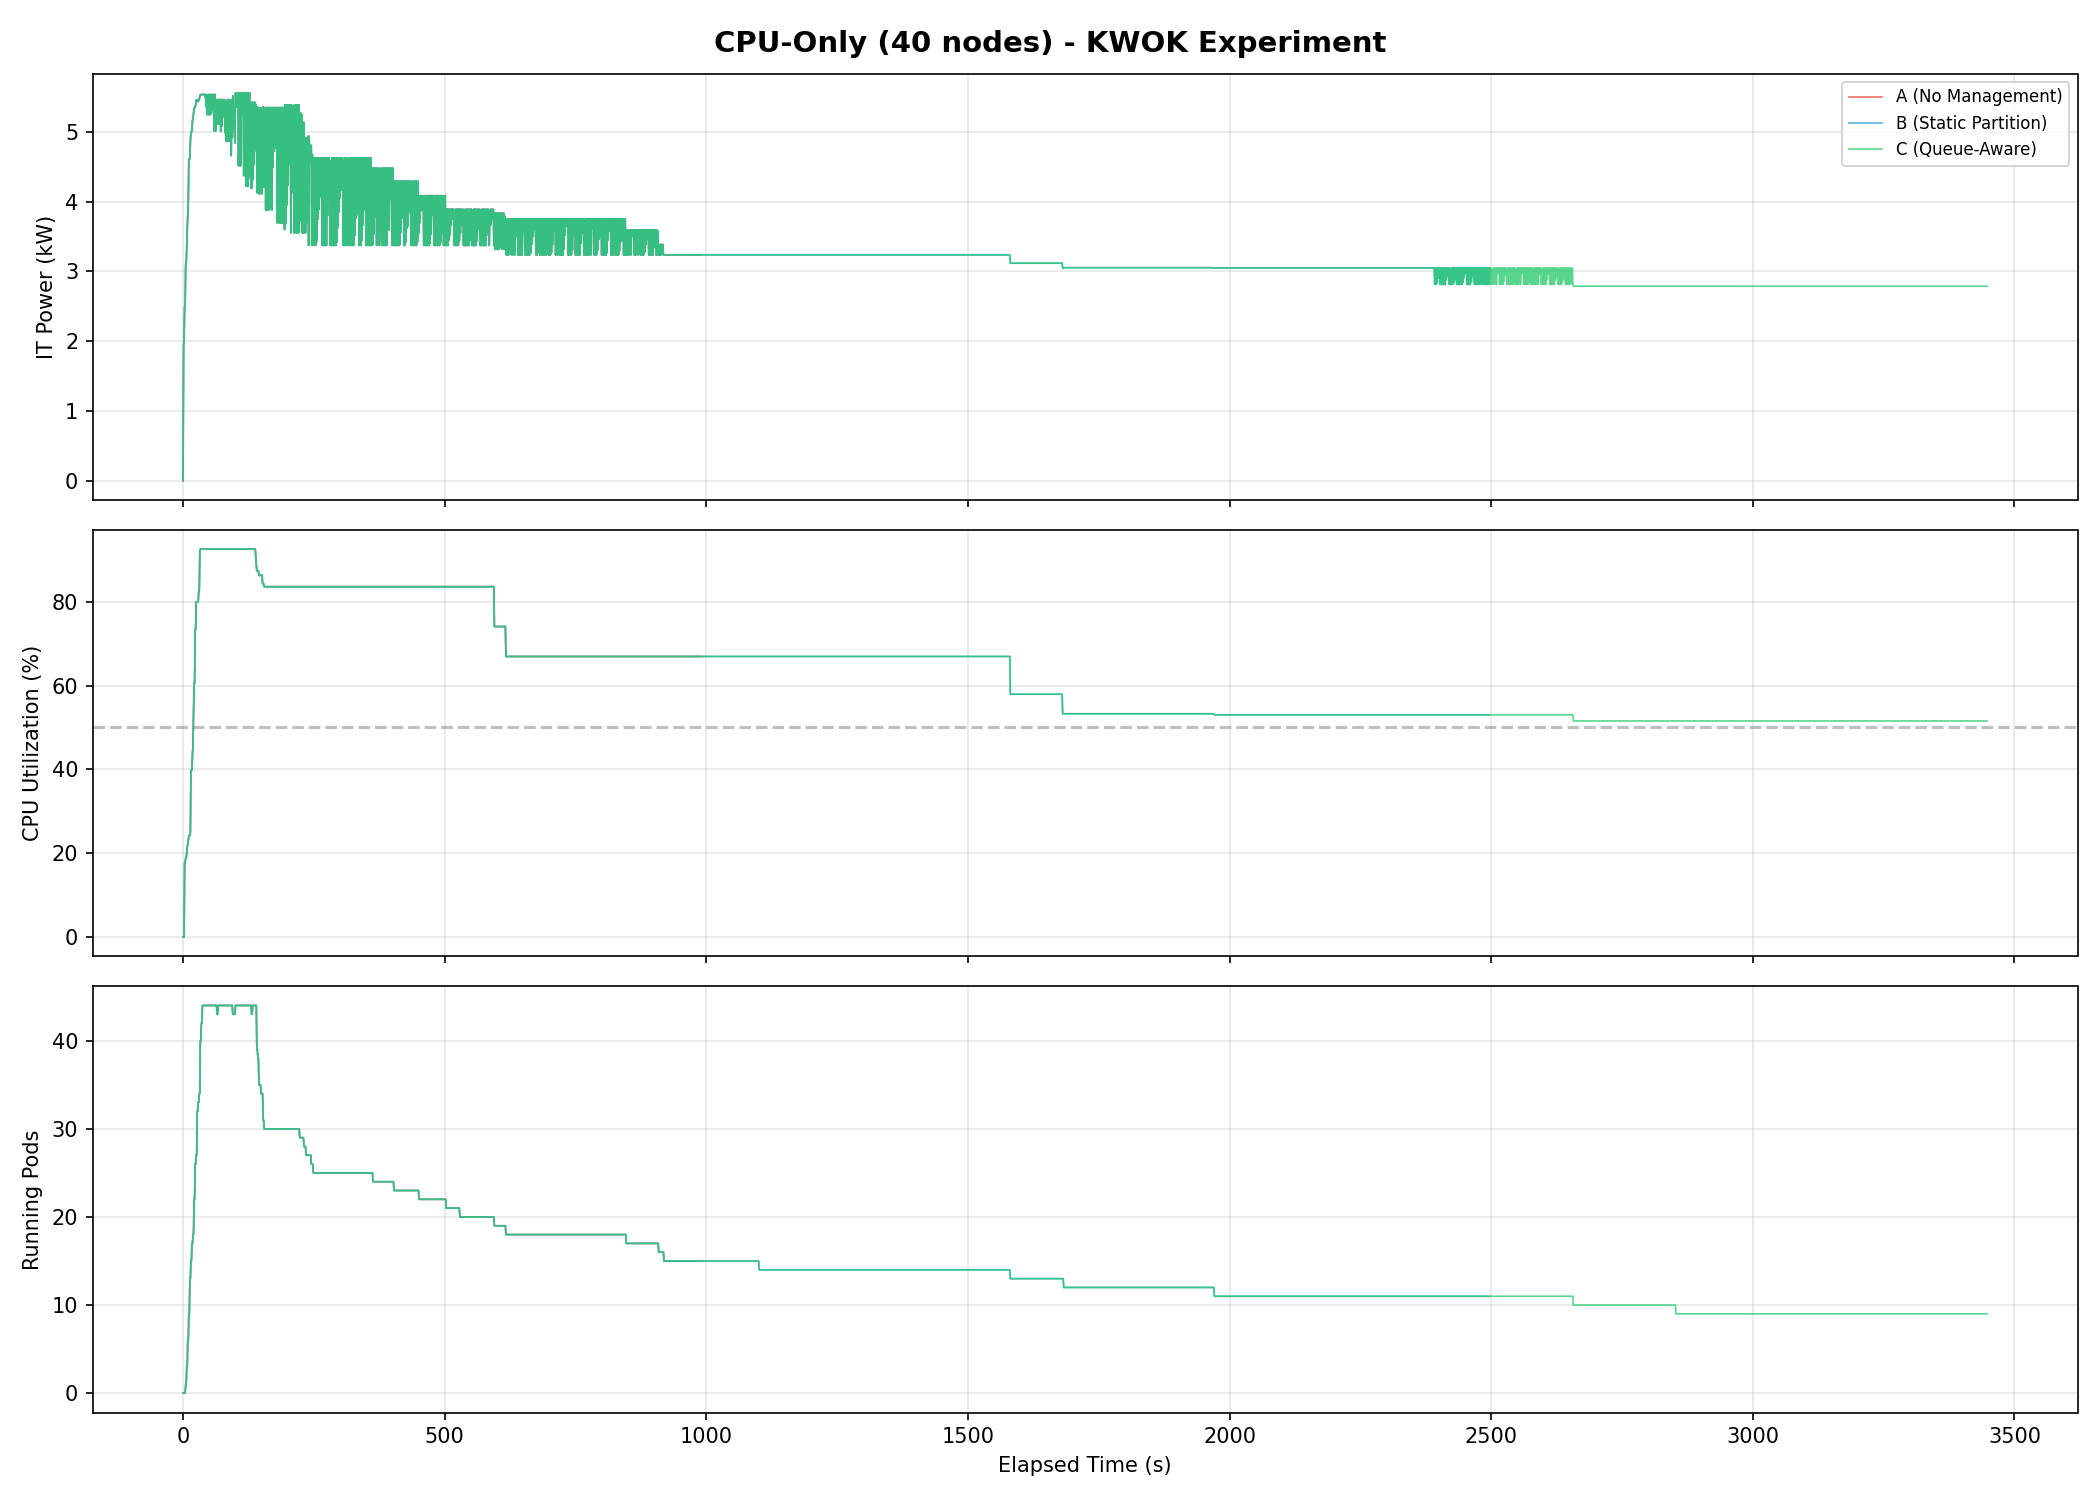
Three-panel timeseries showing IT power (kW), CPU utilization (%), and running pods over the experiment duration. Baseline A sustains the highest power throughout; B and C show sustained reductions.
Energy comparison
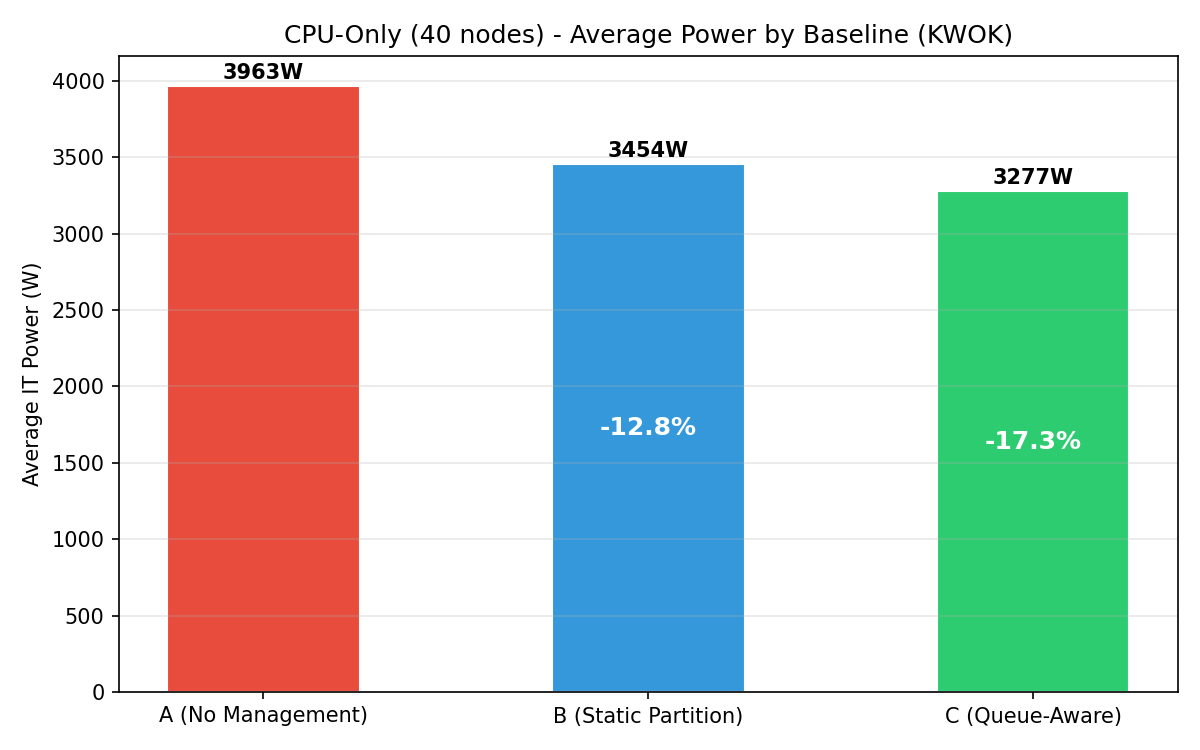
Bar chart of average IT power per baseline with percentage savings annotations. C achieves the deepest savings at −29.1%.
Cumulative energy
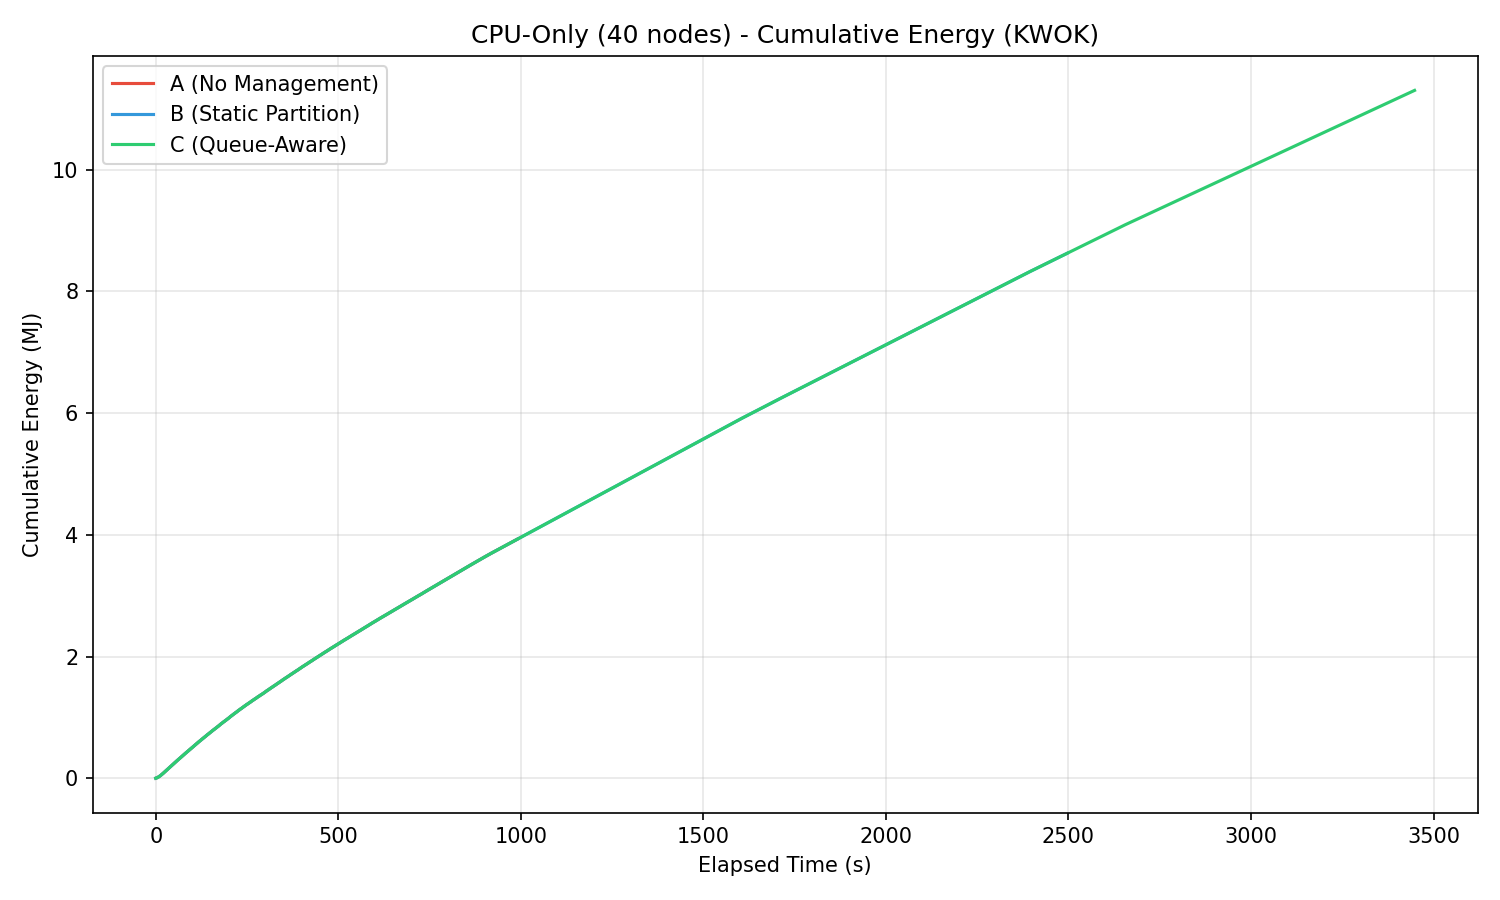
Cumulative energy (MJ) over time. The divergence between A and the managed baselines is visible from the start.
Utilization distribution
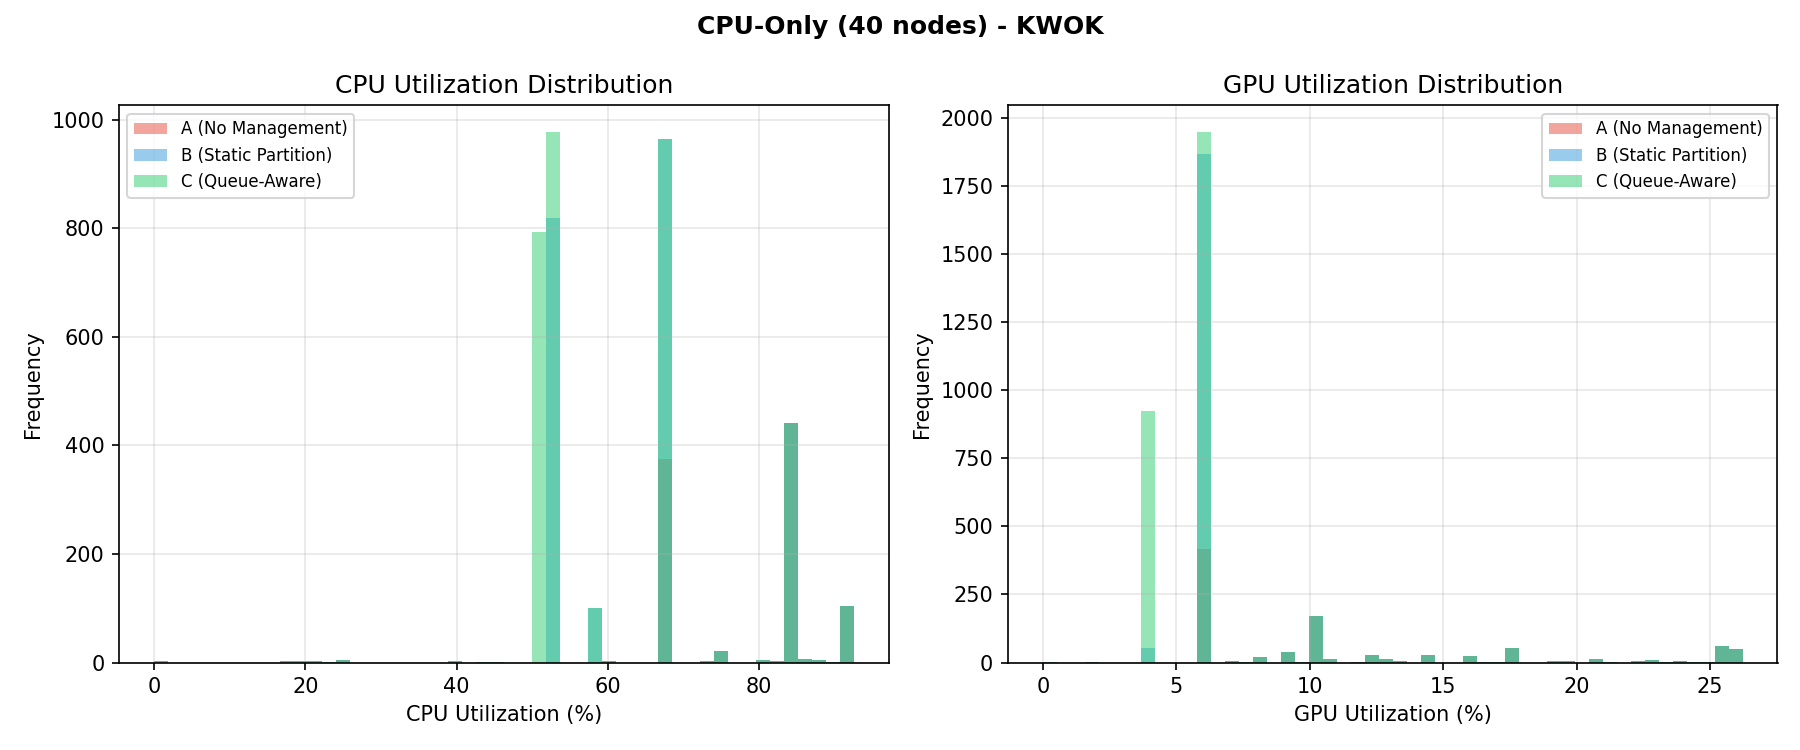
CPU utilization histograms per baseline.
PUE analysis (IT Power, Cooling & PUE)
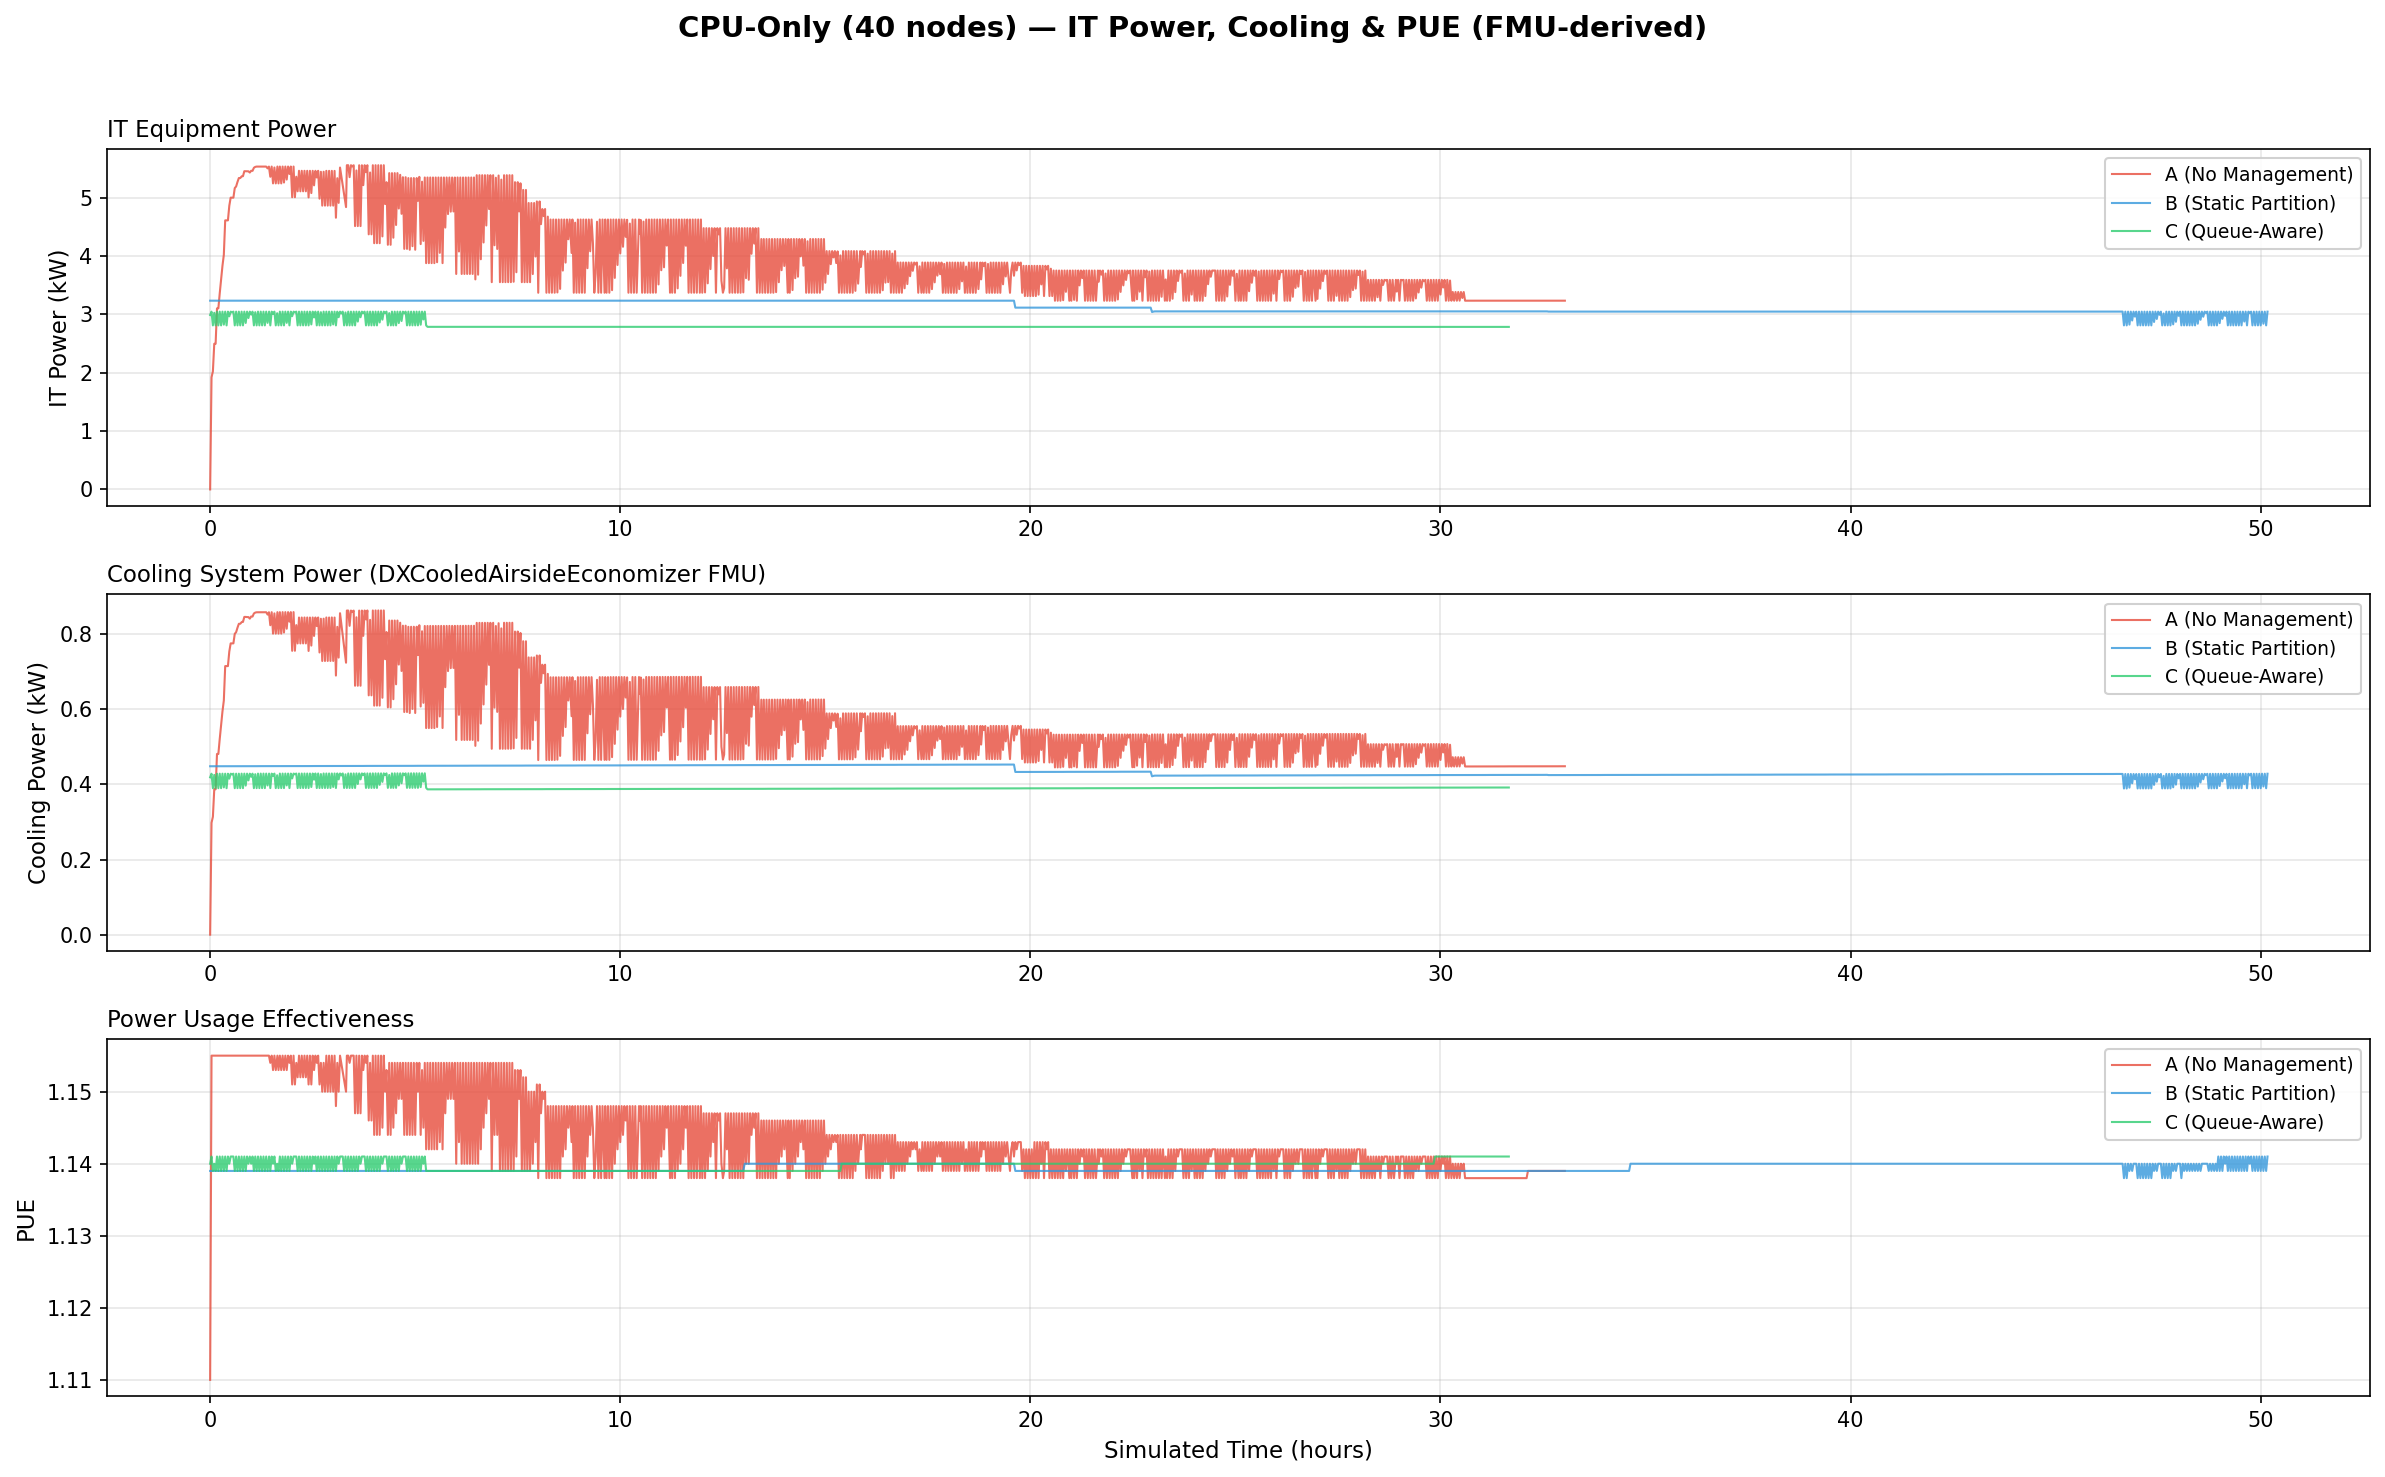
Three-panel stacked timeseries showing IT equipment power (kW), cooling system power (kW), and PUE over simulated time. Cooling power is computed by the DXCooledAirsideEconomizer FMU. Managed baselines achieve lower IT power, reducing cooling demand and marginally improving PUE.
Facility power breakdown
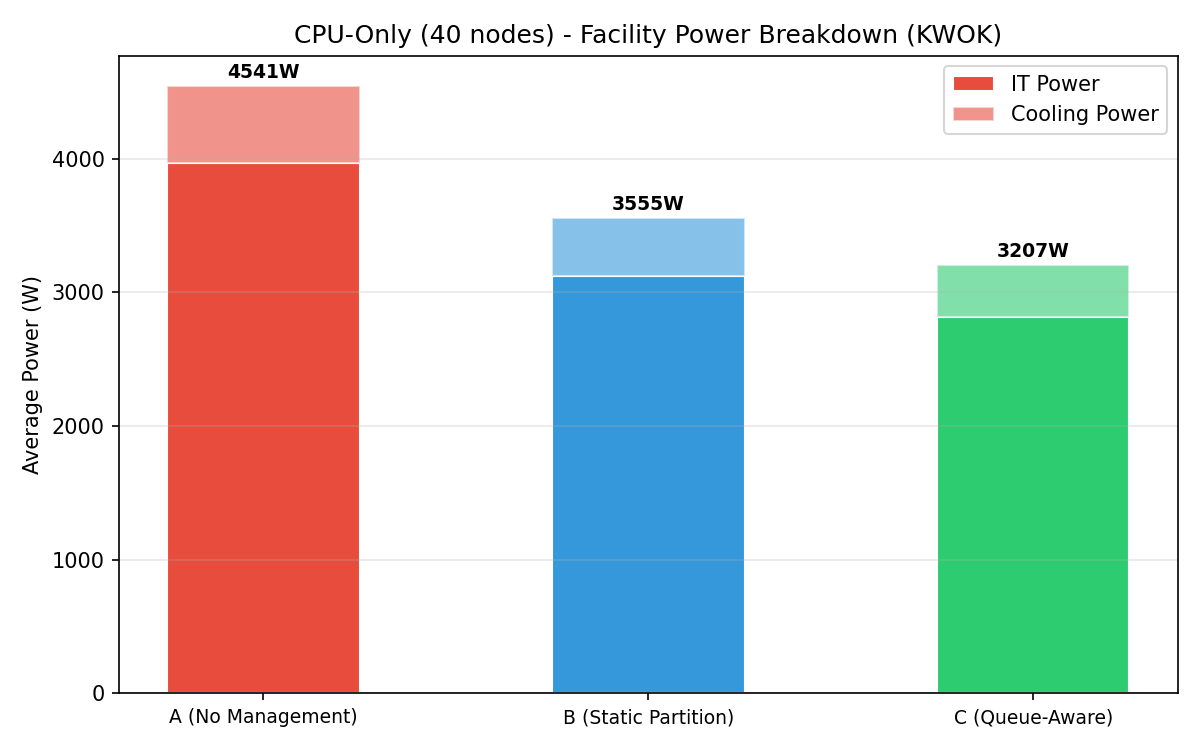
Stacked bar chart showing IT power + cooling power per baseline. Total facility power decreases from A to C, with cooling savings amplifying IT power reductions.
Interpretation
Joulie reduces energy by 21–29% without throughput penalty on a CPU-only cluster because:
- Realistic eco cap (220 W): targets actively-loaded nodes while leaving idle nodes unaffected.
- Workload-aware throughput model: memory-bound and I/O-bound jobs are less sensitive to frequency reduction.
- High cluster utilization (76.8%): ensures eco caps engage meaningfully on most nodes.
- Queue-aware adaptation: C dynamically shifts nearly all nodes to eco during low-demand periods, capturing deeper savings than B’s fixed 30% performance allocation.
Annual projections (5,000-node scale)
Extrapolating to a 5,000-node cluster (125× the 40-node test cluster):
| Metric | B (Static Partition) | C (Queue-Aware) |
|---|---|---|
| Annual energy saved | 927 MWh | 1,262 MWh |
| Equivalent US homes powered | 88 homes | 120 homes |
| Cost savings (@ $0.10/kWh) | $92,739/yr | $126,250/yr |
| CO₂ avoided (@ 0.385 kg/kWh) | 357 tonnes/yr | 486 tonnes/yr |
Assumptions: 8,760 h/yr continuous operation, $0.10/kWh, 0.385 kg CO₂/kWh (EPA US grid avg), 10,500 kWh/yr per US household (EIA).